Figures & data
Figure 1 Factors affecting the response of the brain to hormone replacement therapy.
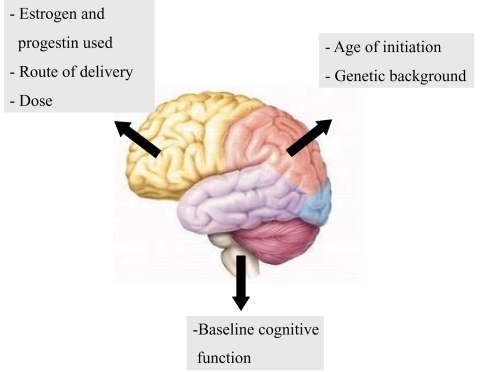
Figure 2 Effect of different concentrations of raloxifene on β-amyloid (βA) (10 and 100 nM) toxicity, as assessed by MTS assay (Promega Corp., Madison, WI).
Notes: *p < 0.05 versus control cells not exposed to β-amyloid (black bars). Modified with permission from CitationBenvenuti S, Luciani P, Vannelli GB, et al 2005. Estrogen and SERMs exert neuroprotective effects and stimulate the expression of seladin-1, a recently discovered anti-apoptotic gene, in human neuroblast long-term cell cultures. J Clin Endocrinol Metab, 90:1775–82.
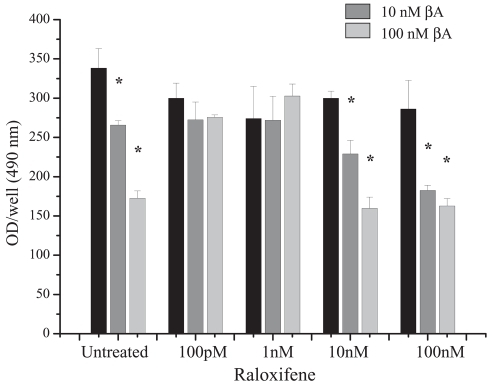
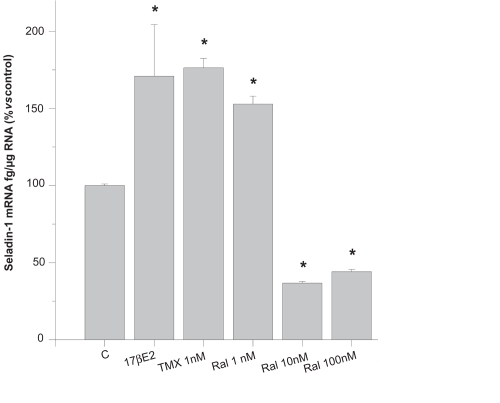
Figure 3 Amount of seladin-1 mRNA, assessed by real-time RT-PCR, in untreated control FNC cells (C), in cells treated with 1 nM 17β-estradiol (17βE2), 1 nM tamoxifen (TMX) or raloxifene (Ral) (1–100 nM).
Notes: *p < 0.05 vs control cells (C) value (112 ± 2.26 fg/μg total RNA, mean ± SE), considered as 100%. Modified with permission from CitationBenvenuti S, Luciani P, Vannelli GB, et al 2005. Estrogen and SERMs exert neuroprotective effects and stimulate the expression of seladin-1, a recently discovered anti-apoptotic gene, in human neuroblast long-term cell cultures. J Clin Endocrinol Metab, 90:1775–82.