Figures & data
Figure 1 Total IES score before (29.5 ± 12.9; range: 1–57) and after (21.8 ± 13.2; range: 1–49) in all patients (n = 28).
Abbreviation: IES, Impact of Event scale.
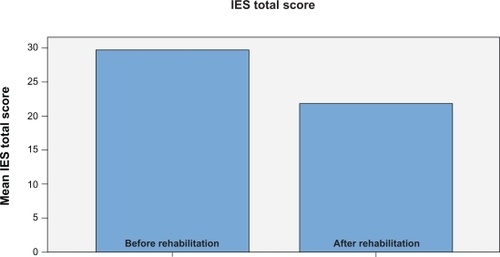
Table 1 Before rehabilitation
Table 3 After rehabilitation
Table 2 Level of stress reaction before rehabilitation
Table 4 Level of stress reaction after rehabilitation