Figures & data
Table 1 Abstinence rates of Phase 2 studies
Table 2 Abstinence rates of varenicline versus active comparator trials
Table 3 Abstinenece rates in other studies
Figure 1 Percentage of varenicline and placebo participants achieving continuous abstinence at Weeks 9–12 and Weeks 9–52 according to nicotine dependence level (low/med/high). Derived from data of CitationNides et al (2008).
Abbreviation: FTND, Fagerström Test for Nicotine Dependence.
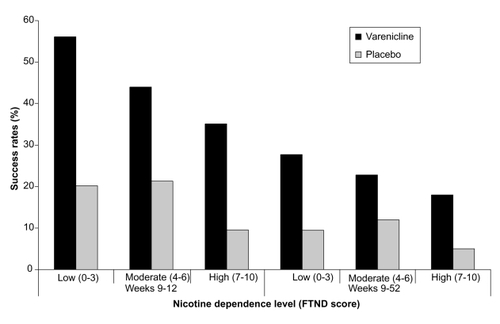
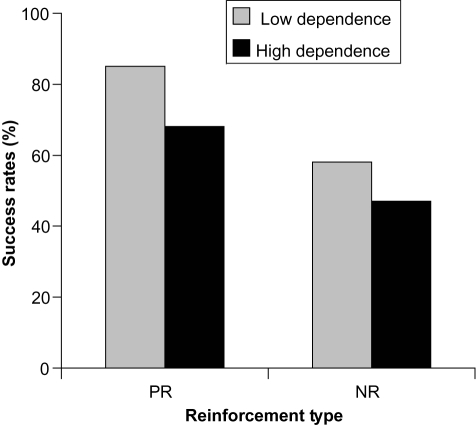
Figure 2 Percentage of varenicline participants who achieved point prevalence abstinence at 6 months according to nicotine dependence level (low vs high) and reinforcement type (positive, PR vs negative, NR). Derived from data of CitationFagerström et al (2007).
Abbreviations: PR, positive reinforcement; NR, negative reinforcement.