Figures & data
Figure 1 Percentage of patients with fibromyalgia meeting the 2-measure and 3-measure composite responder criteria at 3 months, observed cases. From Study 1Citation25 and Study 2.Citation26
*P < 0.01; **P ≤ 0.001, vs placebo.
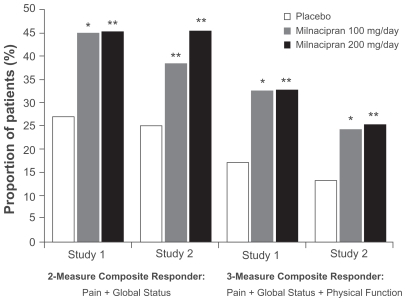
Figure 2 Least squares (LS) mean change from baseline in weekly average 24-hour morning recall pain scores. From Study 2,Citation26 observed cases.
*P < 0.05; †P < 0.01; and §P < 0.001, vs placebo.
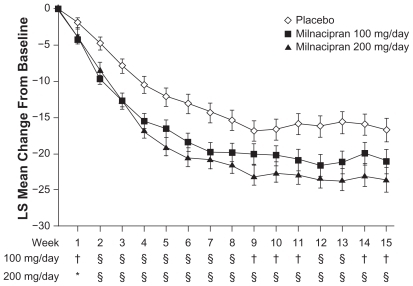
Table 1 Additional significant outcomes receiving 3 months of milnacipran treatment