Figures & data
Figure 1 Test strips run with samples of human chorionic gonadotropin at indicated concentrations. For experimental details, please see text.
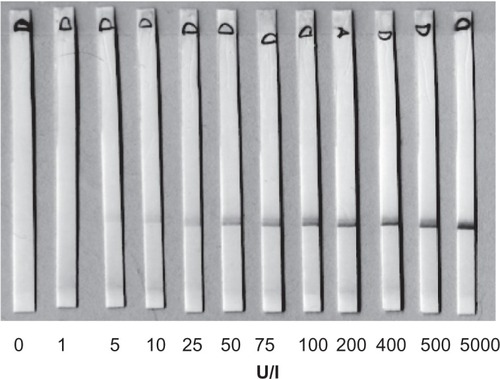
Figure 2 Block diagram of the measuring circuit. The measuring apparatus is made up of two identical receiving coils (RC1 and RC2) and one transmitting coil (TC) around them, which induces the external field. The two receiving coils are connected in series in such a way that voltages, induced by the transmitting coil carrying an alternating current (AC), cancel each other out. The signal is generated by causing a misbalance between receiving coils by putting the detection zone of the immunochromatographic strip inside one receiving coil only. The signal is filtered, amplified (G), and digitized (ADC) before conversion of voltage into concentration units by the digital signal processor (DSP). The instrument can be controlled by the computer (PC) or the result can be downloaded into a computer.
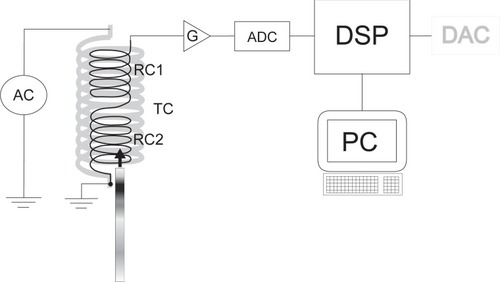
Figure 3 Standard curve obtained with samples of human chorionic gonadotropin (hCG). Concentration of sample in international units (IU) per liter is given on the X-axis. Y-axis shows readings in μV given by the magnetometric device. Insert: sample concentration range 50–10,000 U/l presented in log/log scale.
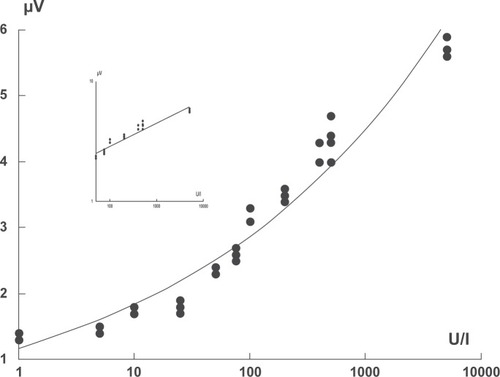
Figure 4 Transmission electron micrograph of superparamagnetic particles used in the present assay. The particles are visualized as black irregularly shaped objects against a background of smaller less electron-dense material. Scale bar 500 nm.
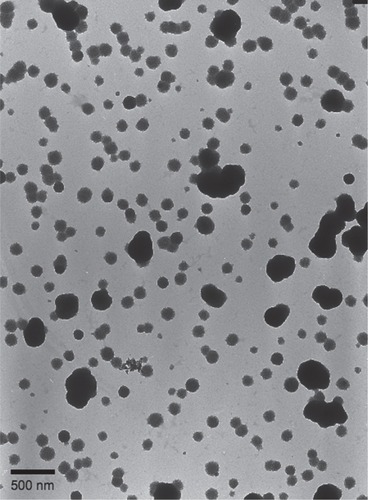
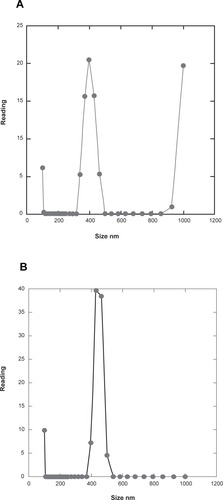
Figure 5 Photonic correlation analysis of superparamagnetic particles used in the present assay. A) Detection angle 60°. B) Detection angle 90°. For experimental details, please see text.