Figures & data
Figure 1 The mfERG uses black and white hexagons presented on a monitor (left) that flicker according to a pseudorandom m-sequence. Each waveform represents the electrical response from a hexagon which stimulates a focal retinal area. The waveforms can be plotted as a trace array (middle) or as a three dimensional response density (amplitudes per unit retinal area) plot (right). The latter reflects the distribution of the cone-mediated (photoreceptor and bipolar) cellular responses.
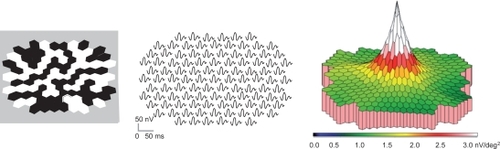
Figure 2 The stimulus array (right) and how the waveform responses were averaged into a central (1) and peripheral (2) area are shown. We analyzed N1P1 trough to peak amplitude response densities and P1 peak implicit times (arrows).
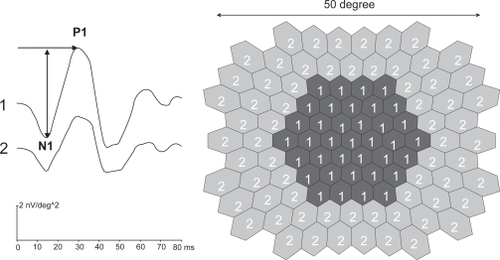
Table 1 The patient’s visual acuity (VA), contrast sensitivity (Contrast) and OCT
Figure 3 The N1P1 amplitudes ± SD (A) and peak implicit times ± SD (B) for the central and peripheral rings for each ARM patient are shown compared with a healthy control group. While P1 implicit times remained stable, N1P1 amplitudes were significantly reduced after the third treatment.
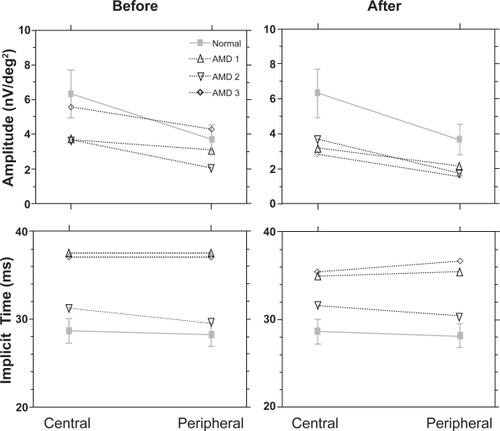
Table 2 The central and peripheral N1P1 response density (above) and P1 implicit time
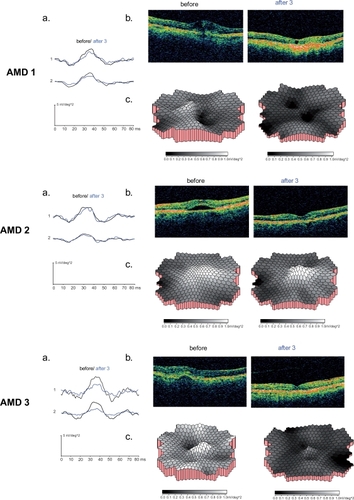
Figure 4 The mfERG and OCT results for the AMD 1 (A), AMD 2 (B) and AMD 3 (C) are demonstrated. The mfERG central and peripheral area waveform averages (a) and OCT images (b) before and after three treatments are shown for each patient. In c. the three dimensional response density plots of each patient compared with the age-similar control group (n = 20) are outlined before and after three treatments with ranibizumab. Note that darker gray scales indicate poorer response densities which were evident in all patients after the third treatment. These were not only reduced in the central area but throughout the whole field up to 25° (see also waveform averages in a).