Figures & data
Table 1 Summary of common disorders of ocular motility in MS (CitationDowney et al 2002)
Figure 1 Comparison of a rightward saccade made to a 22 degree target jump by a normal subject (A) and a patient with MS who has INO (B). Note how the normal subject’s eyes move together, with right eye (abduction) velocity being slightly bigger than that of the left eye. In contrast, the MS patient’s adducting left eye lags behind the abducting right, and right eye velocity greatly exceeds that of the left. Positive values indicate rightward movements. Note the different axes for position and velocity.
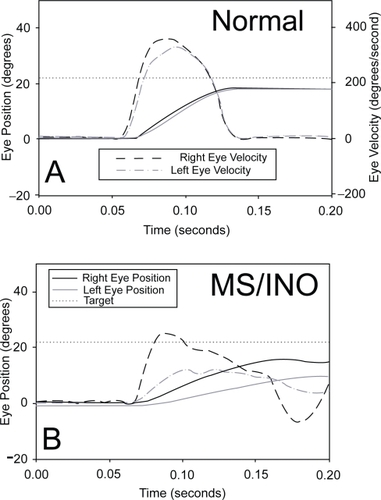
Figure 2 Representative mean right-left velocity profiles of the ocular following responses (OFR) versus time elicited in a patient with MS who had partially recovered from a left optic neuritis. The patient responded to successive ¼-wavelength shifts applied to 1f stimuli (left column) and 3f stimuli (right column) of different contrast (contrast of the pattern is shown by encircled numbers superimposed on traces). A and B: right-eye-viewing sessions (REV). C and D: left-eye-viewing sessions (LEV). Note the smaller LEV responses to the 3f stimuli versus 1f stimuli. Adapted from (CitationRucker et al 2006).
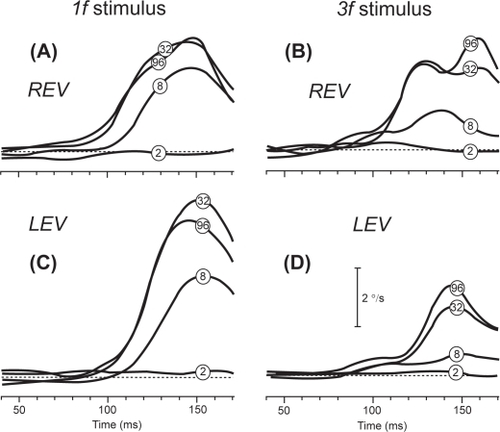
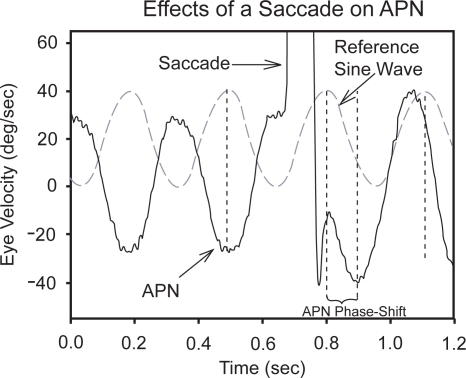
Figure 3 An example of how a large rightward horizontal saccade could reset the phase of acquired pendular nystagmus (APN) in a patient with multiple sclerosis. A sine wave at a similar frequency to the oscillations is shown in dashed gray for reference. Note that before the saccade, the horizontal component of APN and sine wave are about 180 degrees out of phase; after the saccade, this phase difference is greatly reduced (compare positions of vertical dashed lines). The single-position traces are offset to aid clarity of display; positive deflections indicate rightward eye rotations.