49
Views
2
CrossRef citations to date
0
Altmetric
Original Research

Lack of association with high myopia and the MYP2 locus in the Japanese population by high resolution microsatellite analysis on chromosome 18

, , , , , , , , , & show all
Pages 311-316 | Published online: 25 Nov 2022

Figures & data

Figure 1 Shows p values by Fisher’s exact test based on 2 × 2 contingency tables (Red circles) or on 2 × m contingency tables (Blue circles) in the first screening. Blue line indicate p values = 0.05.

Figure 1 Shows p values by Fisher’s exact test based on 2 × 2 contingency tables (Red circles) or on 2 × m contingency tables (Blue circles) in the first screening. Blue line indicate p values = 0.05.

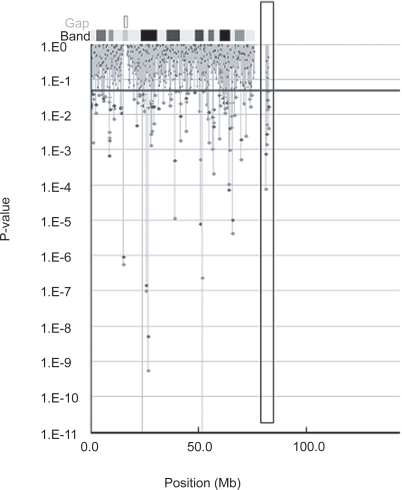
Table 1 Three step screening of pooled DNA method

Table 2 Statistical significance of alleles associated with high myopia on chromosome 18