Figures & data
Figure 1 Comparison of mean IOP for travoprost 0.004%/timolol 0.5% fixed combinaiton and concomitant travoprost 0.004% and timolol 0.5%.
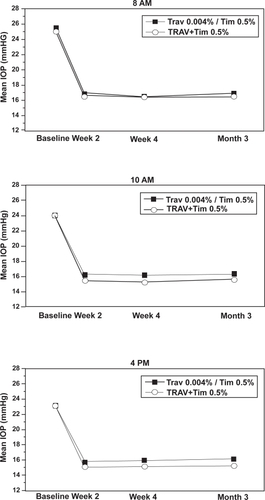
Table 1 Mean IOP comparison for test on non-inferiority
Table 2 Mean IOP change from baseline comparison for test of non-inferiority
Table 3 Overall frequency and incidence of adverse events occurring at rates greater than or equal to 1%