Figures & data
Table 1 Total error score (± SD) in follow-up period
Table 2 Comparison of the initial test (TES0) and the first follow up test (TES12) regarding the color vision defects in glaucoma patients
Table 3 Comparison of the initial test (TES0) and the first follow up test (TES12) regarding the color vision defects in glaucoma-free patients
Table 4 A summary of the values of Pearson r correlation coefficient, the TES from 0–48 months in relation to the MD, and the CPSD after 48 months of follow-up
Figure 1 Graphical representation of the color vision axis defect.
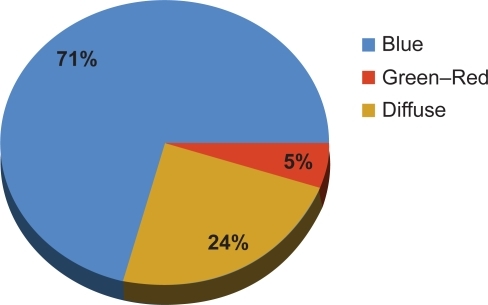
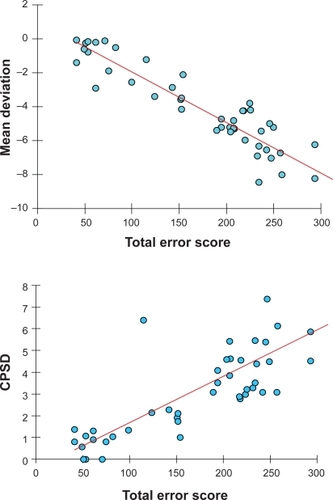
Figure 2 Diagram correlating MD and CPSD with the TES.
Abbreviations: CPSD, corrected pattern standard deviation; MD, mean deviation; TES, total error score.