Figures & data
Table 1 Patient baseline characteristics
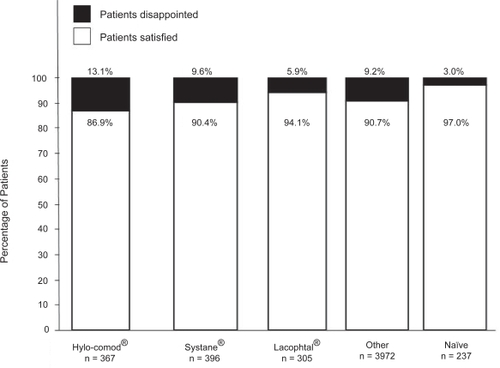
Figure 1 Change in the clinical signs and symptoms at 2 to 4 weeks after switching to Optive.
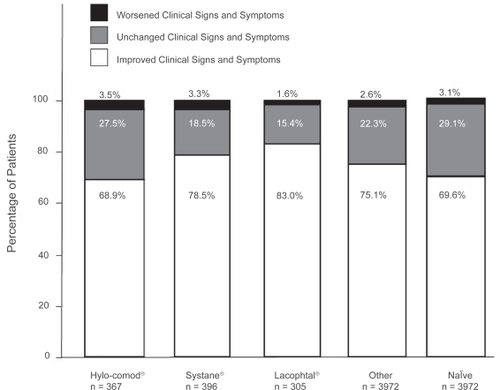
Figure 2 Change in local comfort at 2 to 4 weeks after switching to Optive. The “improvement” category included patients with somewhat to major improvement.
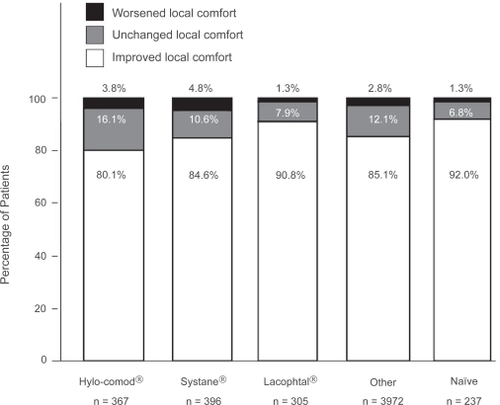
Figure 3 Tear break-up time (TBUT) for all patients. Top panel illustrates the change in TBUT from baseline to final visit after switching to Optive across 7 time categories (≥0 to <4, ≥4 to <6, ≥6 to <8, ≥8 to <10, ≥10 to <12, ≥12 to <15, and ≥15 seconds). Bottom panel illustrates the mean TBUT ± standard deviation (seconds) from baseline to final visit across the categories of dry eye disease severity, to which patients were assigned at initial assessment. Asterisk indicates statistical significance (p < 0.001).
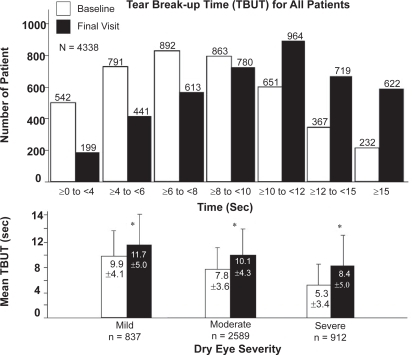
Table 2 Tear break-up time at baseline and at final assessment
Figure 4 Patient satisfaction with the use of Optive. The results in the “satisfied” category showed here included patients who were somewhat satisfied to very satisfied.