Figures & data
Figure 1 Clinical parapapillary atrophy (PPA) evaluation of 2 patients. A) Total PPA clock hours, 12; βPPA clock hours, 5; βPPA as percentage of disc, 60%; βPPA present, temporal; ordinal rating of total PPA, 3. B) Total PPA clock hours, 8; βPPA clock hours, 4; βPPA as percentage of disc, 20%; βPPA present, temporal; ordinal rating of total PPA, 2.
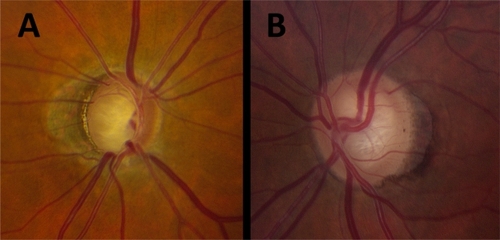
Table 1 Patient and parapapillary atrophy characteristics
Table 2 Simple logistic models: odds of open-angle glaucoma as a function of common clinical variables
Table 3 Simple and multiple logistic models: odds of open-angle glaucoma as a function of parapapillary atrophy (PPA) variables