Figures & data
Table 1 Clinical and experimental tests to diagnose dry eye and their intended use. References are given only for those tests that are not described in the present review
Table 2 Schirmer’s test variants and cut-off values
Figure 1 Fluorescein clearance test results. The black line indicates the portion of the strip wetted by tears. 1A: in healthy subjects, the wetting length is ≥3 mm and fluorescein stains only the first strip, whereas the wetted portion increases in the second and third strips. 1B: in case of delayed tear clearance, fluorescein stains all three strips and normal wetting length is observed. 1C: in the event of aqueous tear deficiency without reflex tearing, the wetting length is nearly 0 mm for all 3 strips; 1D: in the event of aqueous tear deficiency with reflex tearing, the wetting length of the first strip is 0 mm and increases especially in the third strip, when nasal stimulation is performed.
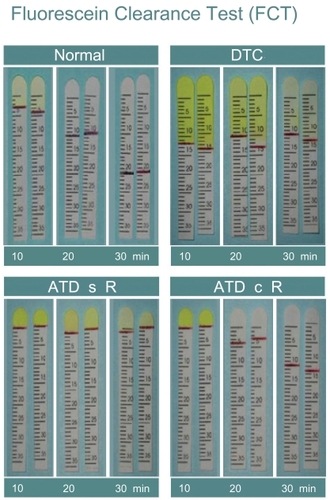
Figure 2 Rose Bengal staining of the Marx line.
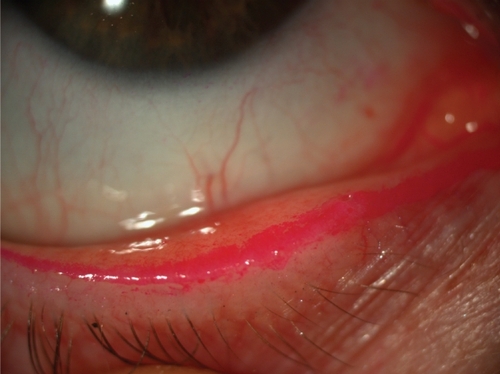
Figure 3 Typical dotted staining of the conjunctiva by rose bengal.
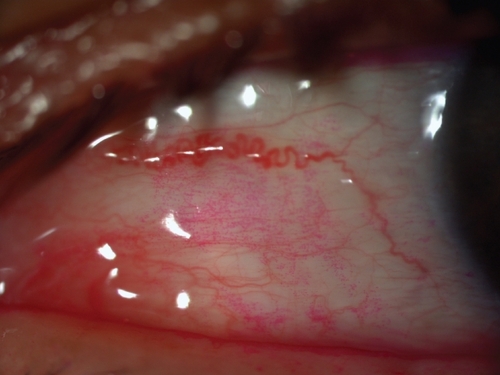
Figure 4 Tear break-up time assessed by fluorescein.
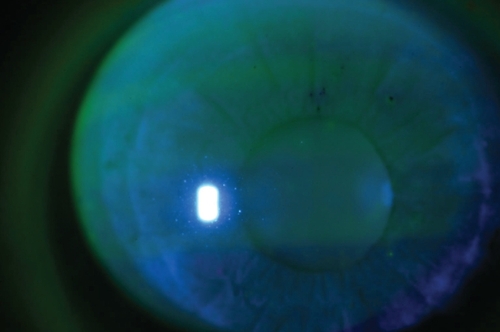
Figure 5 Representative TSAS data of patients with mild (A), moderate (B) and severe damage of tear film stability (C). Graph shows the consecutive changes in SRI (surface regularity index, blue line) and SAI (surface asymmetry index, red line).
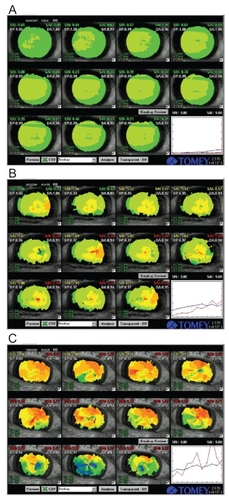
Figure 6 Visual acuity and SRI at ordinary free blinking and after sustained eye opening in dry eye patients and normal controls. Left Pane: Functional visual acuity decreased significantly in the non-SS and SS groups compared to normal controls. Right pane: the SRI recorded after sustained eye opening increased significantly in the non-SS and SS groups compared to normal controls. Non-SS - non-Sjögren’s syndrome type dry eye, SS - Sjögren’s syndrome patients, Control – normal controls, BCVA - best-corrected visual acuity (decimal notation), FVA – functional visual acuity (decimal notation), SRI - surface regularity index of corneal topography, 10s SRI – SRI recorded after 10 seconds of sustained eye opening. Reprinted from Goto et al, Optical Aberrations and Visual Disturbances Associated With Dry Eye, The Ocular Surface -2006-4-page 208 with the permission of the authors and Ethis Communications.
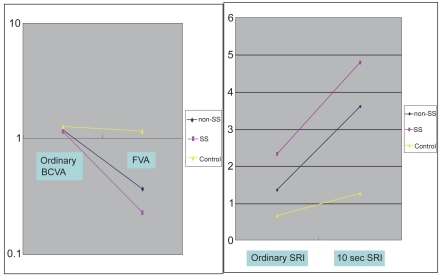
Figure 7 Visual Acuity and SRI during ordinary free blinking and after sustained eye opening in dry eye patients and dry eye patients with punctal plug. Left pane: ordinary BCVA in ATD patients was 1.16 and that in ATD patients with punctal plug was 1.22 (P = 0.6). On the contrary, FVA in ATD was 0.283 and that in ATD with punctal plug was significantly higher, 0.962 (P < 0.0001). Functional visual acuity decreased significantly only in ATD without punctal plug, and remained within the normal range in ATD with punctal plug. Right Pane: the SRI recorded after 10 seconds of sustained eye opening (10 sec SRI) increased in both groups. 10 sec SRI was significantly lower in ATD with punctal plug. ATD – aqueous tear deficiency dry eye, ATD PO - aqueous tear deficiency dry eye after the treatment with punctal plug insertion, BCVA - best-corrected visual acuity (decimal notation), FVA – functional visual acuity (decimal notation), SRI - surface regularity index of corneal topography, 10s SRI – SRI recorded after 10 seconds of sustained eye opening. Reprinted from Goto et al, Optical Aberrations and Visual Disturbances Associated With Dry Eye, The Ocular Surface -2006-4-page 209 with the permission of the authors and Ethis Communications.
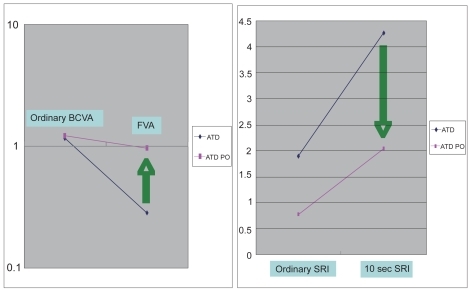
Figure 8 Example of FVA measurement result using FVAM System. Left Pane: normal control. a; Best-corrected visual acuity. b; FVA was 0.8 at 10.8 seconds of sustained eye opening. c; Response time. d; FVA was 0.8 at 60 seconds of sustained eye opening. Right pane: dry eye subject. e; Best-corrected visual acuity. f; FVA was 0.63 at 9.8 seconds of sustained eye opening. g; FVA was 0.1 at 39.1 seconds of sustained eye opening. Reprinted from Goto et al, Optical Aberrations and Visual Disturbances Associated With Dry Eye, The Ocular Surface -2006-4-page208 with the permission of the authors and Ethis Communications.
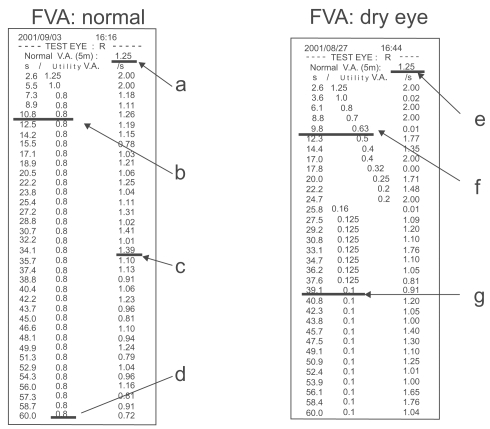
Figure 9 Cross-sectional imaging of the tear meniscus obtained by optical coherence tomography.
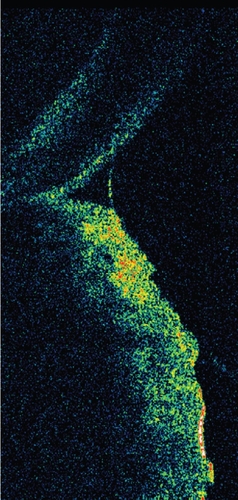
Table 3 Lower tear meniscus height as reported in the peer-reviewed literature
Figure 10 DR-1 tear interference image of Sjogren syndrome patient. A tear interference image of Sjogren syndrome patient (60 years old Asian female). The tear lipid layer is visualized over a corneal area with a diameter of approximatively 8 mm. On the lower corneal area, the thickened tear lipid can be seen in a colorful interference images. On the contrary, in the upper corneal area, a thin and deficient lipid layer can be observed with dark interference color. Such an unevenly distributed lipid could be caused by the deficiency of the aqueous tear component in the Sjogren syndrome patients.
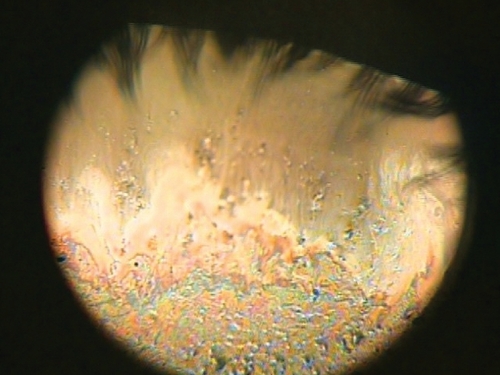
Figure 11 Instrument setup (A), schematic diagram of the probe to measure tear evaporation (B), and measurement of tear evaporation (C). (A) Counter clockwise from the upper left; personal computer with evaporation measurement software, probe, drying unit, gas flow meter, frequency counter, power supply, and air compressor are shown. (B) Schematic diagram of the air resource, frequency counter, power supply, and personal computer are also shown. Air is dried during passage through a drying unit (20 x 200 mm) containing silica gel. (C) The subject holds the probe as gently as possible without allowing air to leak from the chamber. Reprinted from Goto et al, Tear Evaporation Dynamics in Normal and Obstructive Meibomian Gland Dysfunction Subjects, Investigative Ophthalmology and Visual Science –2003; 44 -page534 with the permission of the authors and the Association for Research in Visual and Ophthalmology.
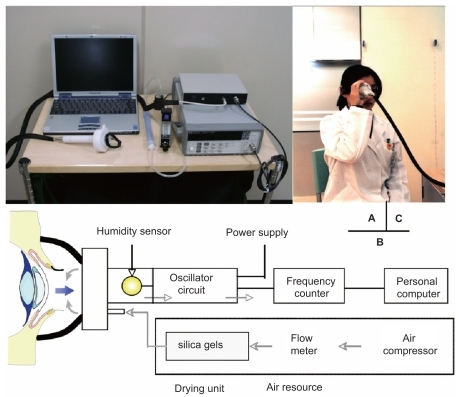
Table 4 Review of tear evaporation rates in literature (means ± standard deviation, 10−7 × g/cm2sec, Table Footnote* tear evaporation rates in 10−7 × g/sec)