Figures & data
Figure 1a Proportion of African Ancestry as determined from polymorphisms within 178 AIMs for normal self-described black ADAGES participants (n = 45).
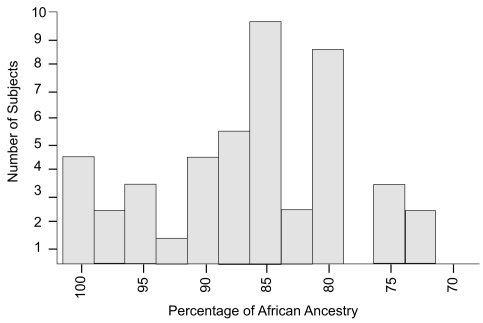
Figure 1b Mean (±standard deviation) percentage Ancestry in the four Ancestral Groups determined by polymorphisms within 178 AIMS for normal Self-described black ADAGES participants (n = 45).
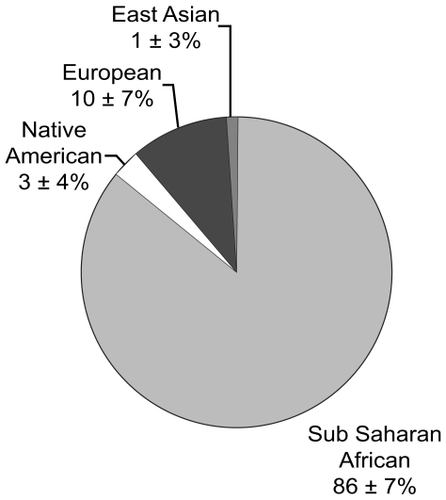
Table 1 Comparison of structural parameters of the optic disc between African-American and White groups