Figures & data
Table 1 Patient demographics
Figure 1 Phacoemulsification: Pre-op versus post-op.
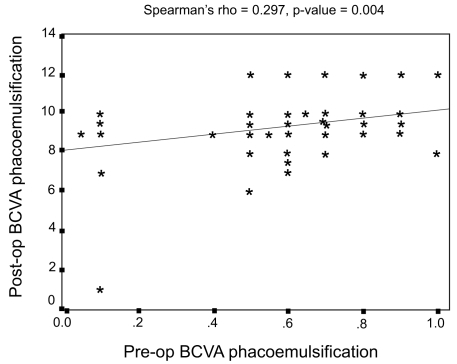
Figure 2 Phacotrabeculectomy: Pre-op versus post-op.
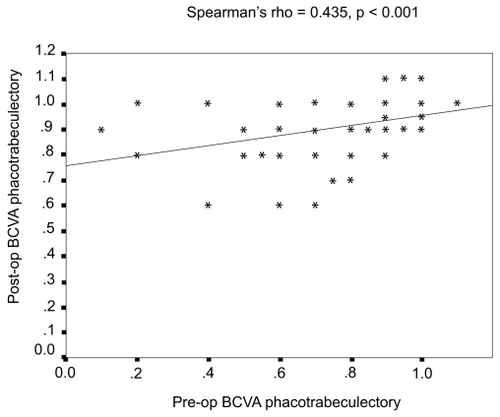
Figure 3 BCVA lines lost/gained.
Abbreviation: BCVA, best corrected visual acuity.
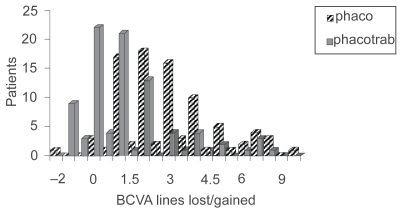
Table 2 Postoperative complications
Table 3 Pre- and postoperative mean spherical equivalent in the study groups
Table 4 Statistics for the visual outcome presented as DE: Independent samples test
Figure 4 Analysis of postoperative spherical equivalent.
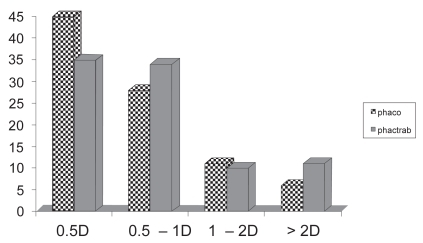
Figure 5 Analysis of postoperative with the rule astigmatism.
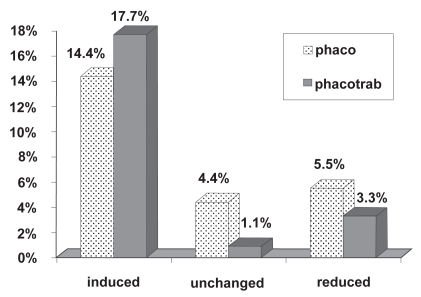
Figure 6 Analysis of postoperative against the rule astigmatism.
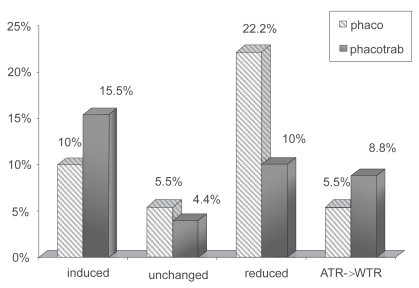
Table 5 Astigmatic results of the phacoemulsification group and phacotrabeculectomy group