Figures & data
Figure 1 Schematic illustration of the precorneal tear film (PCTF) outlining comprising layers (Not to scale).
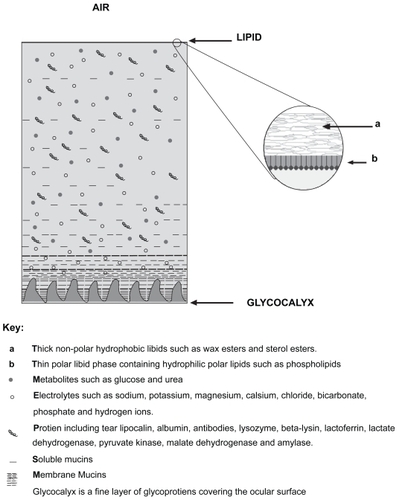
Table 1 Composition of the investigated formulations
Figure 2 The appearance of the precorneal tear film lipid layer, (a) intact and (b) disrupted.
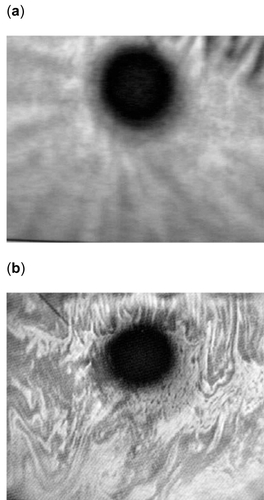
Figure 3 The Phenol Red thread test. Note the dark and bright discoloration of the thread indicating wet and dry portions respectively.
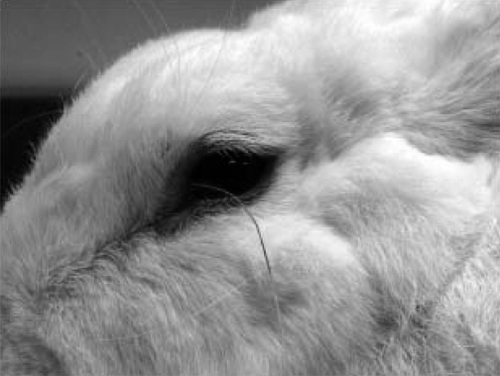
Table 2 Time required by the lipid layer to return to its baseline pattern as measured by the Tearscope™ after instillation of the test formulations. Results are presented as mean ± SD, N = 6
Figure 4 The tear evaporation rate, measured using a Servomed Evaporimeter. Data were recorded at different time points after instillation of different formulations. Results are presented as mean ± SD, N = 6.
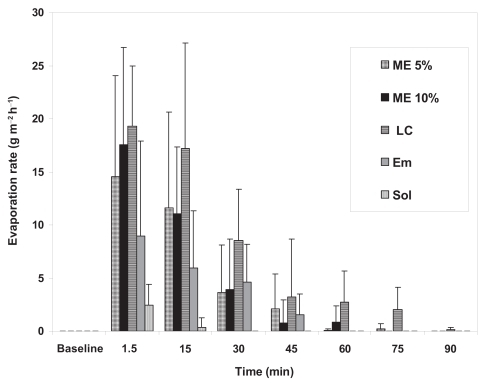
Table 3 The area under the evaporation rate versus time curve (AUC) presented as mean values ± SD, N = 6 in relation to surfactant content and viscosity of the test formulations
Table 4 The difference in the wetted length of the Phenol Red thread calculated from post-instillation minus pre-instillation length. Results presented as mean ± SD, N = 6