Figures & data
Figure 1 Fundus photograph of the right eye (A) reveals marked optic nerve head edema. Same eye, two weeks after optic nerve sheath fenestration with resolution of optic nerve head edema (B).
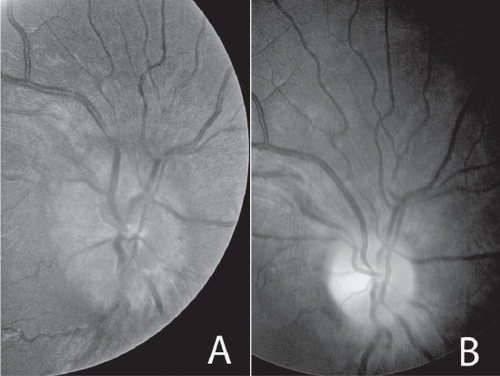
Figure 2 T1 weighted, axial MRI of the brain with contrast reveals diffuse leptomeningeal enhancement (A). T2 weighted, coronal MRI of the brain reveals thickening of the optic nerve-meningeal complex (↑) and increased CSF signal in subarachnoid space (B).
Abbreviations: CSF, cerebral spinal fluid; MRI, magnetic resonance image.
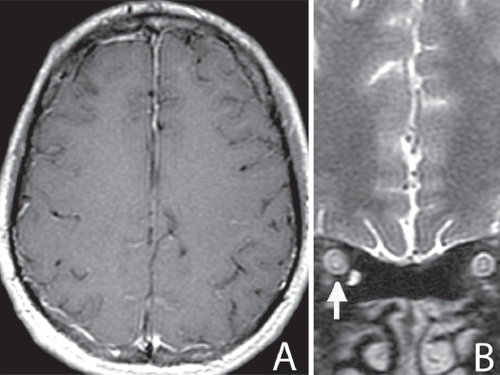
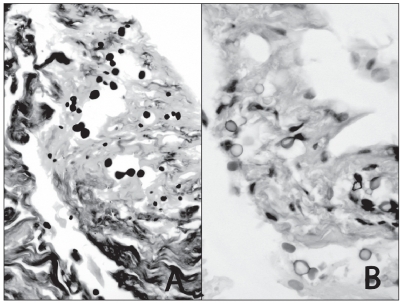
Figure 3 Budding yeast organisms stain with Gomori methenamine silver stain (A) (GMS stain; high power). The capsules of cryptococci stain with mucicarmine stain (B) (Mucicarmine stain; high power).