Figures & data
Figure 1 Contrasts of a small flat target (20 cm × 20 cm, p = 0.2) and a pedestrian (p = 0.16) when located at varying positions on the road and the roadside. The results represent two different road lighting conditions measured in dry weather conditions at Ring Road III Vantaa, Finland. The road surface was illuminated by 250 W high pressure sodium lamps with a pole spacing of 55 m. The target contrasts vary between C = −0.88–0.72.
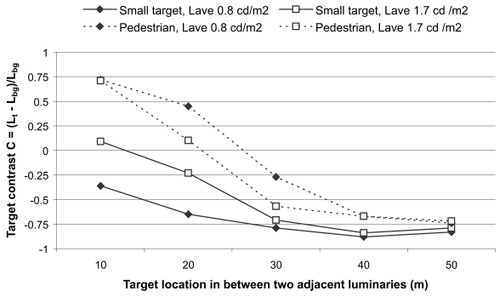
Table 1 a)The values of x given by the modified MOVE-model as a function of photopic luminance and S/P-ratio. b) The values of Lmes given by the modified MOVE-model as a function of photopic luminance and S/P-ratio
Figure 2 a) Coefficients x of MOVE- and modified MOVE-model, and coefficient X of X-model as a function of photopic luminance for HPS (S/P = 0.65) and MH (S/P = 2.35) lamps. b) The ratio of mesopic luminance (calculated using the MOVE-, modified MOVE-, and X-models) to photopic luminance as a function of photopic luminance for HPS (S/P = 0.65) and MH (S/P = 2.35) lamps.
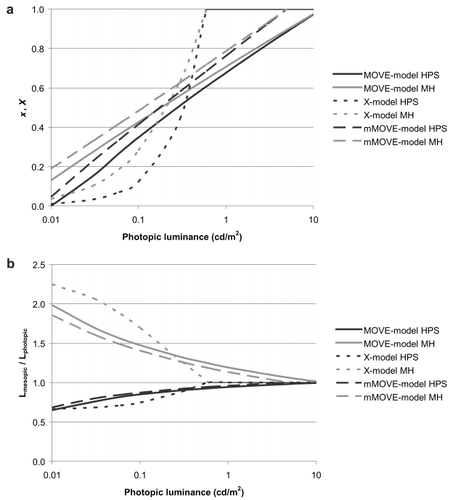
Table 2 The experimental setups and measurement parameters of the three independent visual performance datasets
Figure 3 Mesopic contrast thresholds of L-LAB detection threshold data (CitationRaphael and Leibenger 2007) as a function of target color at an eccentricity of a) 6°, b) 10°, c) 14°.
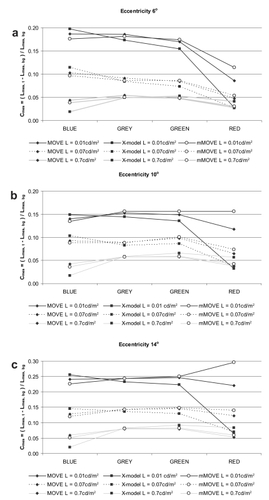
Figure 4 The mesopic contrast threshold of UP detection threshold data (CitationVas and Bodrogi 2007) as a function of target peak wavelength.
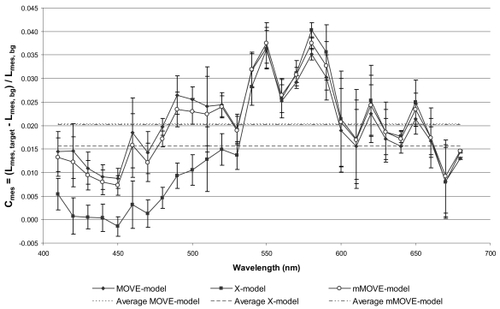
Figure 5 The mesopic contrasts of HUT reaction time data (CitationOrreveteläinen 2005) that produce common reaction times as a function of dominant wavelength of target colors at background luminance level of a) 0.1 cd/m2, b) 0.3 cd/m2, c) 1 cd/m2, d) 3 cd/m2.
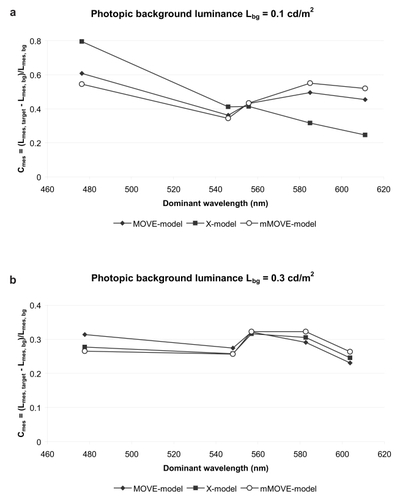
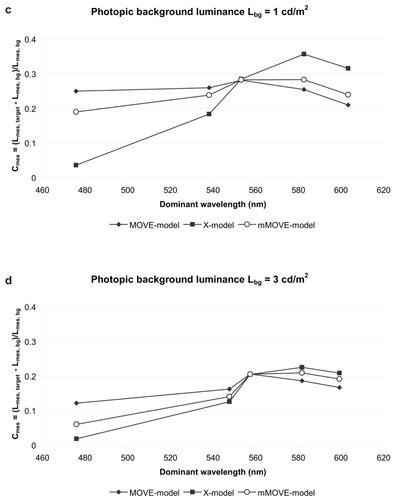
Table 3 The standard deviations between the mesopic contrasts calculated using the MOVE-, modified MOVE-, and X-models