Figures & data
Table 1 Mean visual acuity and central retinal thickness following a single bevacizumab injection (n = 15)
Figure 1 Distribution of visual acuity (logMAR) in 15 eyes between baseline, 4 and 8 weeks following a single bevacizumab injection. Interval improvement in vision is represented by points above the line. A) Baseline versus 4 weeks. B) Baseline versus 8 weeks. C) 4 weeks versus 8 weeks.
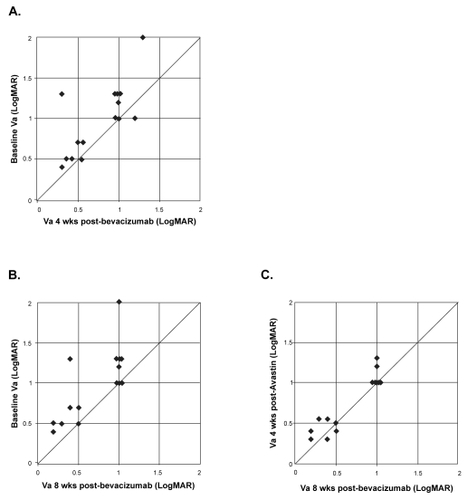
Figure 2 Distribution of central 1-mm retinal thickness (CRT) at baseline, 4 and 8 weeks following a single bevacizumab injection. Decreased central retinal thickness is represented by points above the line. A) Baseline versus 4 weeks. B) Baseline versus 8 weeks. C) 4 weeks versus 8 weeks.
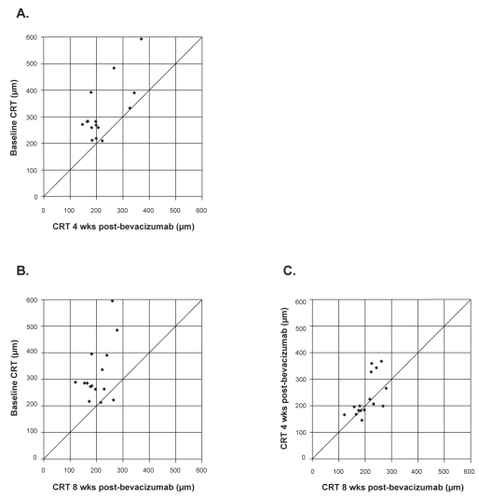
Figure 3 Representative optical coherence tomography (OCT) images of an eye with retinal angiomatous proliferation that had improvement in macular and subretinal pigment epithelial fluid between 4 and 8 weeks following a single intravitreal injection of bevacizumab. A) Baseline OCT images through central macula. B) OCT images at 4 weeks. C) OCT images at 8 weeks.
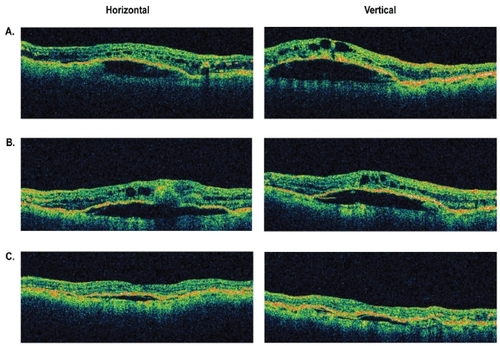
Figure 4 Representative optical coherence tomography (OCT) images of an eye with retinal angiomatous proliferation that had resolution of macular and subretinal pigment epithelial fluid at 4 weeks and maintained a dry macula at 8 weeks after a single intravitreal bevacizumab injection. A) Baseline OCT images through central macula. B) OCT images at 4 weeks. C) OCT images at 8 weeks.
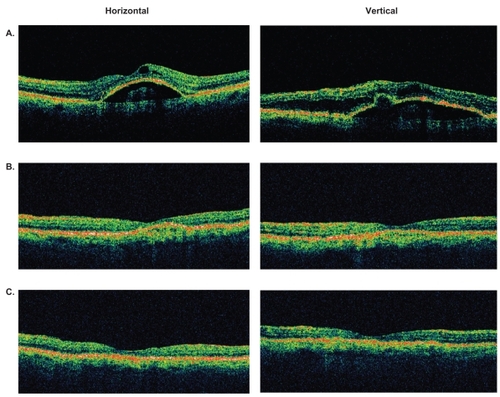
Table 2 Masked grading of OCT images at baseline, 4, and 8 weeks