Figures & data
Table 1 Demographics and diagnoses
Table 2 Concomitant therapy with latanoprost
Figure 1 Monotherapy group: Patients were on latanoprost 0.005% monotherapy prior to the switch to travoprost 0.004% monotherapy. Six months after the switch the IOP was reduced by approximately an additional 1 mmHg (mean + SEM, p < 0.1; n = 60).
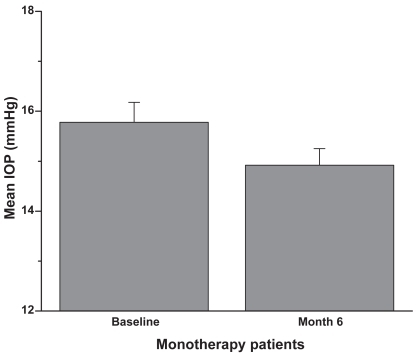
Figure 2 Concomitant therapy group: Patients were on latanoprost 0.005% plus concomitant therapy prior to the switch to travoprost 0.004% plus concomitant therapy. Six months after the switch the IOP was reduced by approximately an additional 1 mmHg (mean + SEM, **p < 0.01; n = 126).
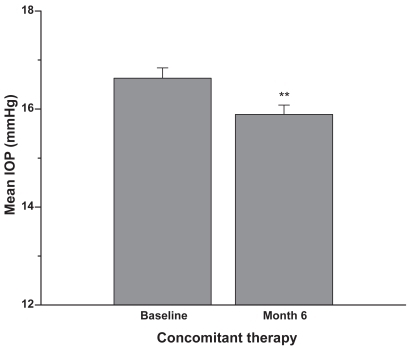
Figure 3 Patients were on latanoprost 0.005% monotherapy or latanoprost plus concomitant therapy prior to the switch to travoprost 0.004%. Six months after the switch the IOP was reduced by approximately an additional 1 mmHg (mean + SEM, **p < 0.001; n = 186).
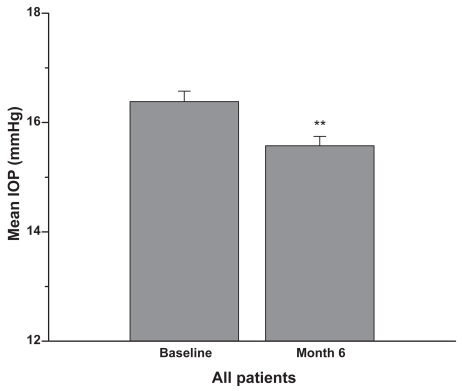
Figure 4 Patients were on latanoprost 0.005% monotherapy or concomitant therapy prior to the switch to travoprost 0.004%. Data presented are based on the number of eyes with IOP measurement available from the specific visit. Changes = Follow-up IOP – Baseline IOP of the same eye. A negative number indicates a reduction in IOP. The results indicate that in each group, the within-eye IOP changes from pre-switch to 6 months (n = 60 monotherapy; n = 126 concomitant therapy) after switch were statistically significant (mean + SEM, ***p < 0.001, †p < 0.0001).
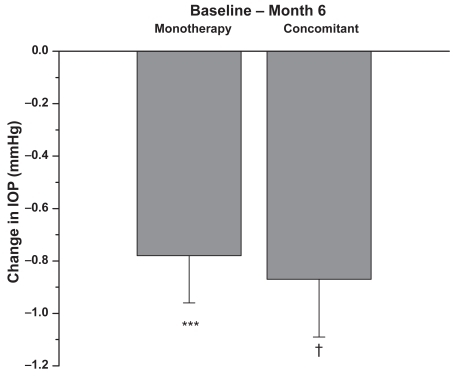
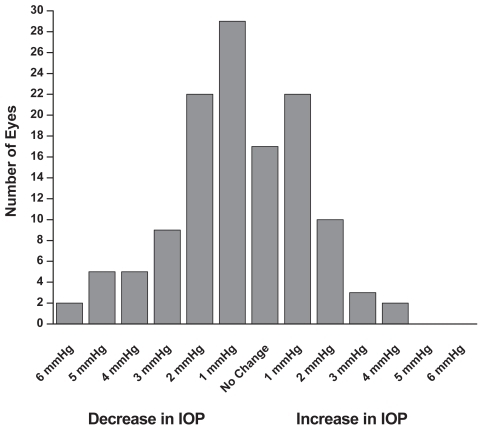
Figure 5 At 6 months, a few patients previously on monotherapy experienced an increase in IOP while several experienced a decrease in IOP of 3 mmHg or more (n = 60).
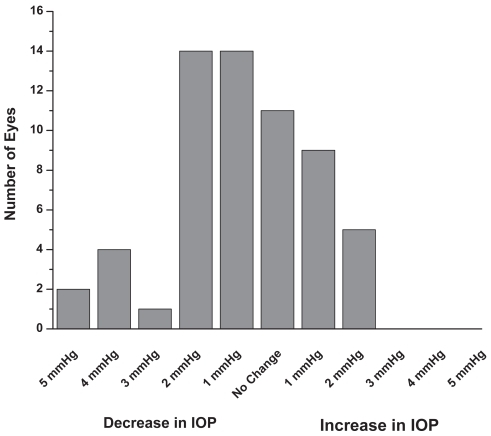
Figure 6 At 6 months, a few patients previously on concomitant therapy experienced an increase in IOP while several experienced a decrease in IOP of 3 mmHg or more (n = 126).