Figures & data
Figure 1 A, Large granuloma of the iris of OS. Keratic precipitates located on the lower part of corneal endothelium are also visible. B, Ultrasound biomicroscopy shows an homogenous, cystic-like lesion of the angle.
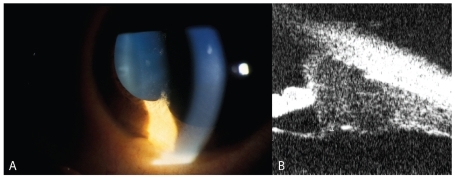
Figure 2 Fundus photograph OS shows the optic nerve granuloma caused by direct sarcoid tissue infiltration.
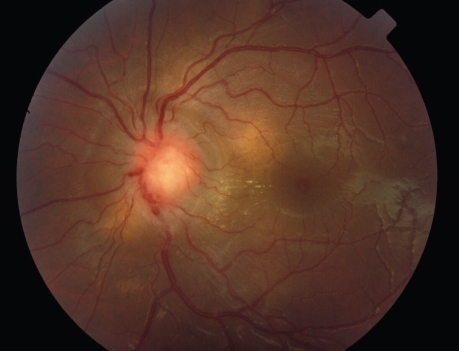
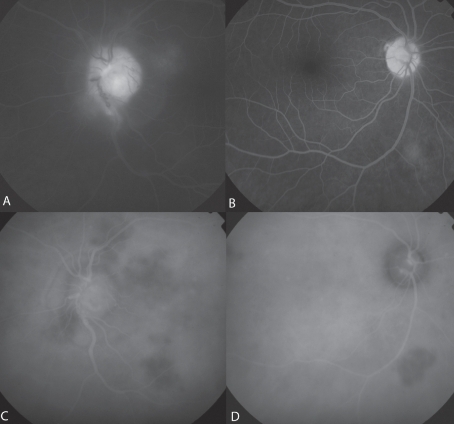
Figure 3 A, Late-phase fluorescein angiogram OS showing optic disc leakage secondary to uveitis. B, Late-phase fluorescein angiogram OD exhibits an hyperfluorescent area corresponding to the granuloma. C, Late-phase ICG angiogram OS reveals multiple choroidal hypofluorescent lesions of the posterior pole, optic disc leakage secondary to uveitis. D, Late-phase Indocyanine angiogram OD showing a single hypofluorescent area corresponding to the granuloma.