Figures & data
Figure 1 Absolute value of the intereye differences in contraction amplitude in normal subjects and in patients with unilateral amblyopia.
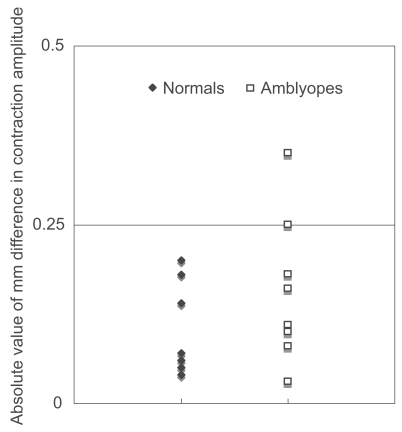
Figure 2 Visual acuity of the amblyopic eye and the difference in contraction amplitude (stimulation of non-amblyopic eye minus stimulation of amblyopic eye).
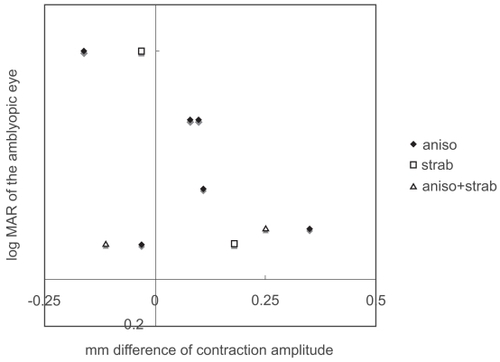
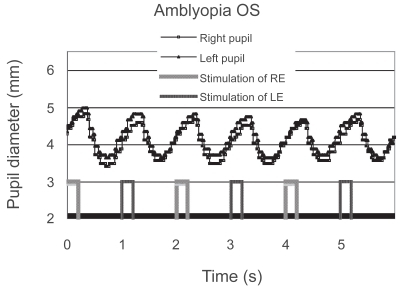
Figure 3 Pupillographic tracings of an 8-year-old girl with anisometropic amblyopia OS. The visual acuity OS was 20/30. The timing of light stimulation is shown below the pupillographic tracings. The right-eye stimulation resulted in a greater contraction than did the left-eye stimulation.
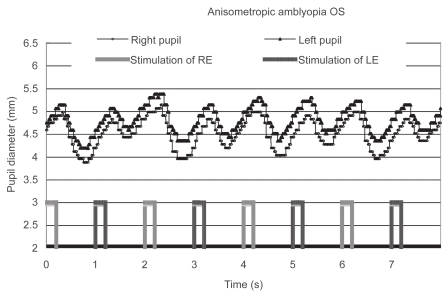
Figure 4 Pupillographic tracings of an 11-year-old boy with anisometropic and strabismic amblyopia OS. The visual acuity was 20/30 in the left eye. The contraction amplitude was slightly larger when the right eye was stimulated.
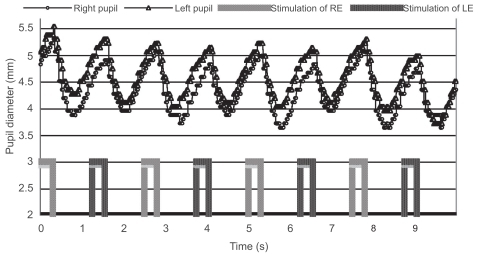
Figure 5 Pupillographic tracings of a 10-year-old girl with anisometropic and strabismic amblyopia OS. The visual acuity was 20/100 in the left eye. The contraction amplitudes were similar regardless of the eye stimulated.