Figures & data
Table 1 Demographics and Inclusion criteria
Table 2 Risk factors associated with increased prevalence of glaucoma damage
Figure 1 Optic disc and peripapillary atrophy.
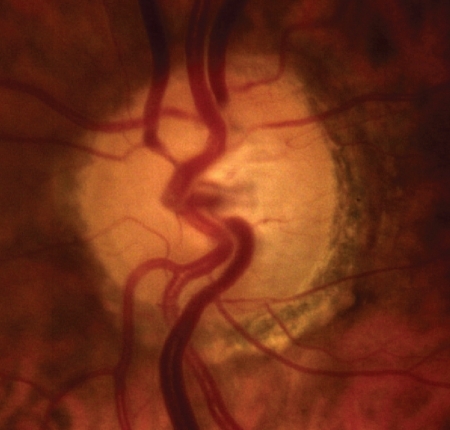
Figure 2 Mapping of cupping, disc and peripapillary atrophy.
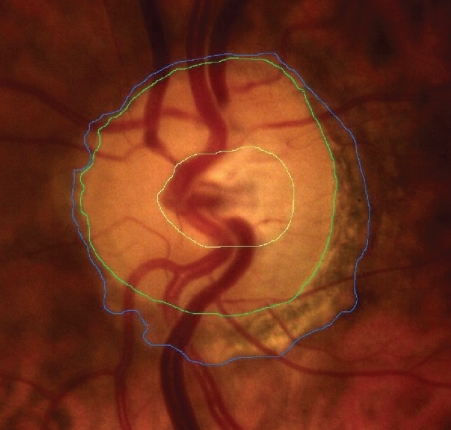
Figure 3 Cupping area (C).
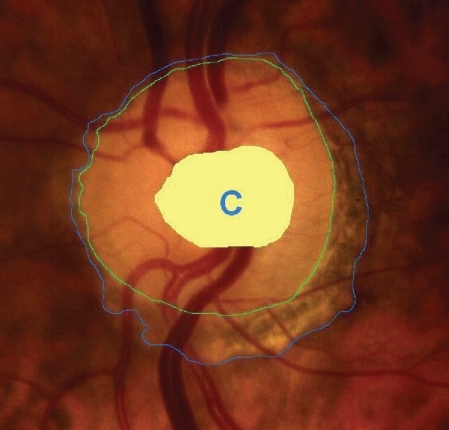
Figure 4 Disc area (D).
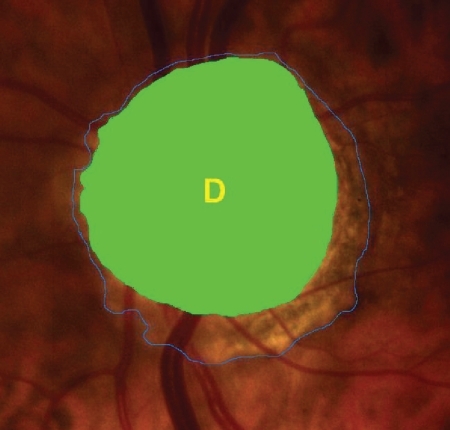
Figure 5 Peripapillary atrophy (PPA).
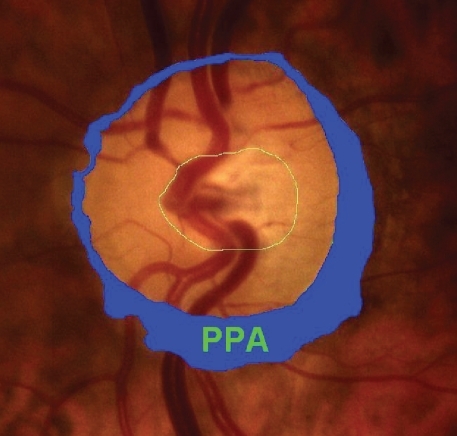
Table 3 Descriptive statistics
Table 4 Intergroup variation (ANOVA)
Figure 6 Relationship between AXL and D in Group A (healthy eyes).
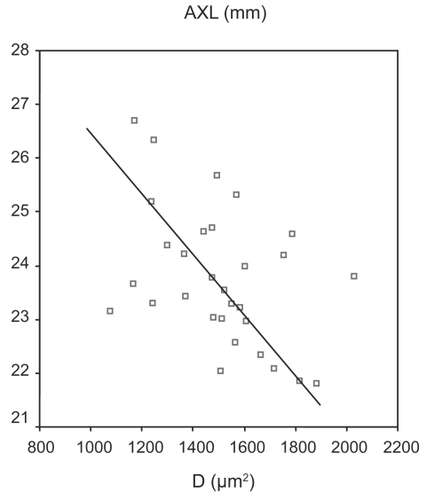
Figure 7 Relationship between CCT and C/D area in Group B (POAG eyes).
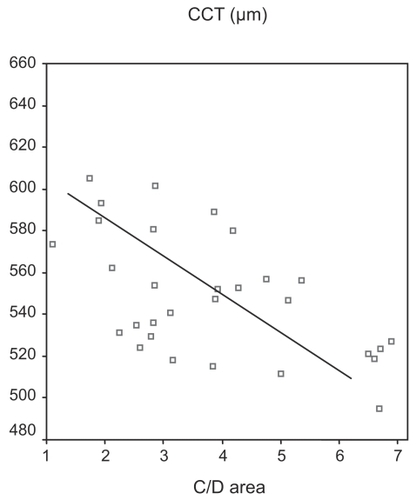
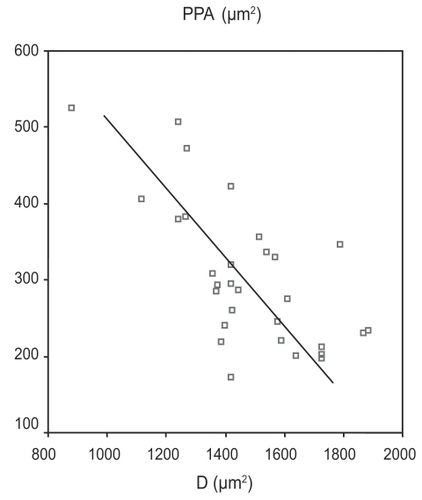
Figure 8 Relationship between PPA and D in Group C (OH eyes).