Figures & data
Figure 1 Retinal function and morphology in P23H rats during their development. Changes in retinal morphology and function by ERG of P23H rat are demonstrated. Hematoxyline-eosine staining of retinal sections at 1 mm from optic disc of P23H rat eyes during different ages were photographed (A), and rows of ONL nuclei were analyzed (B) as described in Materials and methods.
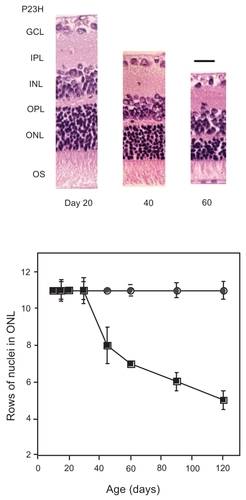
Figure 2 Time course of Rho regeneration during dark adaptation. Control or P23H rats (Day 20) were dark-adapted from regular room light (650 lux). At several time points, 0, 1, 2, 4, and 6 h, rats were euthanized and enucleated eyes were processed to direct Rho concentration analysis as described in the Materials and Methods. For one analysis two eyes from one rat were used. Experiments were performed in triplicate using fresh preparations.
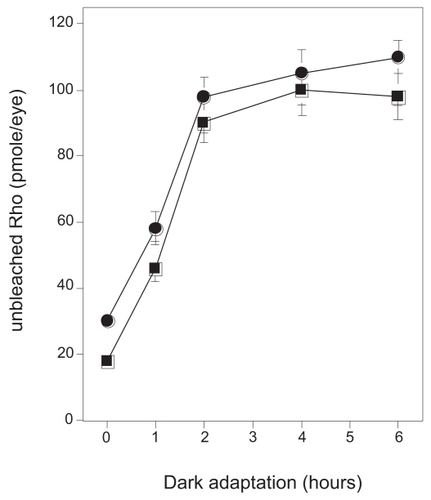
Figure 3 Kinetics of dephosphorylation in phosphorylated 334Ser and 338Ser in control and P23H rats. Four-week-old control and P23H rats were exposed to regular room light (650 lux) for 6 h and then were maintained under dark condition. Rho phosphorylation level was evaluated at three different time points (0, 1, 2, 3, 4, 6, 12, 24, 48, 72, and 96 h, n = 3 per group), with immunofluorescence labeling by anti-P-Rho antibodies. Vertical length of photoreceptor outer segment layers and that of fluorescence labeling was measured at temporal points 1.0 mm apart from optic disc from 6 different points from 3 different eyeballs and their ratios were plotted.
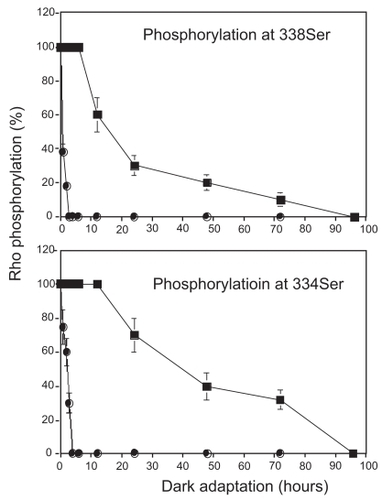
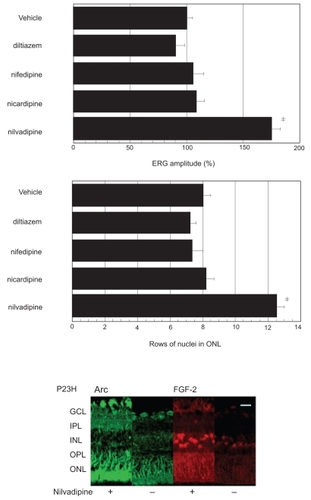
Figure 4 Effects of several Ca2+ channel blockers on retinal function and morphology in P23H rats. P23H rat were treated with Ca2+ channel blockers, D-cis-diltiazem, nifedipine, nicaridipine nilvadipine or their vehicle solutions and thereafter retinal function by ERG and morphological analysis (upper panel) were performed. ERG measurements were performed in 10 eyes (5 rats) in each condition, and b-wave amplitudes of drug treated rats were compared with those of vehicle treated rats. Hematoxyline-eosine stained retinal sections at 1mm from optic disc of P23H rat eyes treated as above were photographed, and rows of ONL nuclei were analyzed as described in Materials and methods.
Abbreviations: GCL, ganglion cell layer; IPL, inner plexiform layer; INL, inner nuclear layer, OPL, outer plexiform layer; ONL, outer nuclear layer; OS, outer segment.