Figures & data
Figure 1 Location of 13 microsatellite markers used in this study. The heavy bar above the chromosome represents the 2p22.1-p22.3 region including the GLC3A locus.
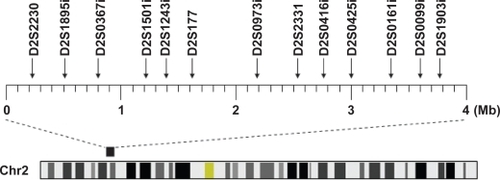
Table 1 Primer sequences of 13 microsatellite markers used in this study
Table 2 Frequencies of 13 microsatellite markers in NTG cases and controls