Figures & data
Figure 1 Mechanism of action of non-steroidal anti-inflammatory drugs (NSAIDs) and corticosteroids.
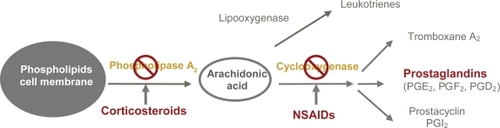
Table 1 Patients’ demographic and pre-operative systemic and ocular pathology
Figure 2 Comparison of horizontal pupil size in the nepafenac and control groups during surgery.
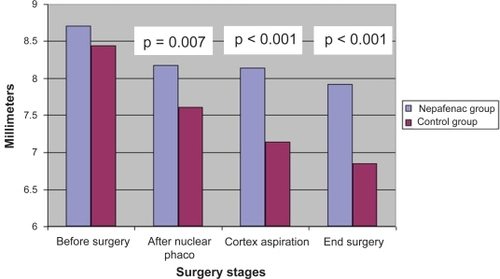
Table 2 Mean horizontal diameter of the pupil during the different stages of cataract surgery
Table 3 Decrease in pupil diameter (failure to maintain mydriasis) at the end of surgery and its relative risk
Table 4 Average foveal thickness (FT) and total macular volume (TMV) in the control and nepafenac groups
Table 5 Differences in total macular volume (TMV) from baseline 2 and 6 weeks after surgery
Table 6 Differences in total macular volume (TMV) from baseline 2 and 6 weeks after surgery in the presence and absence of diabetes mellitus