Figures & data
Figure 1 Developed nonlinear multivariable regression model.
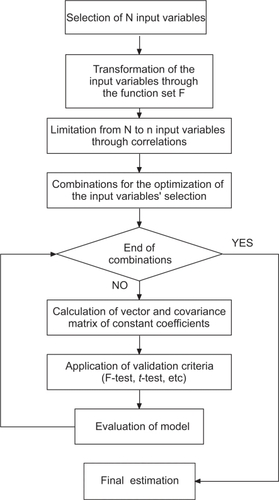
Figure 2 Actual and estimated values of the central corneal thickness using the nonlinear multivariable regression model for the data set of 49 eyes measured.
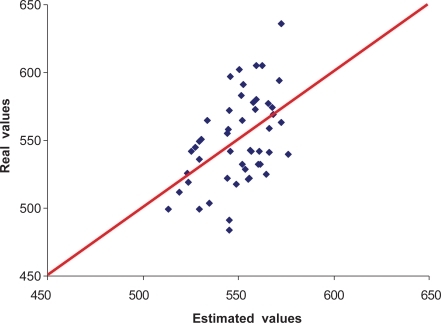
Figure 3 Distribution of corneal thickness according to diagnosis (POAG, NTG, PXF, PG).
Abbreviations: CCT, central corneal thickness; NTG, normal tension glaucoma; PG, pigmentary glaucoma; POAG, primary open-angle glaucoma; PXF, pseudoexfoliative glaucoma.
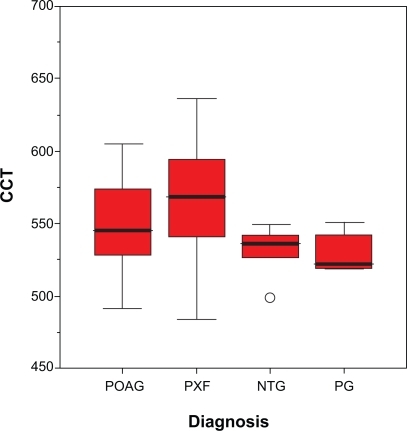
Table 1 Descriptive statistics per type of glaucoma (mean ± SD)
Table 2 R2 criterion between the experimental and the predicted values of CCT for simple linear regression model of one input variable