Figures & data
Figure 1 Case 1 Findings in a 23-year-old woman with AZOOR at onset (kindly provided by Professor Hiroyuki Iijima of Yamanashi University Hospital). A) Fundus photograph of posterior pole of the right eye. Fundus appears normal. B) Visual field defect characterized by enlargement of blind spot and deep scotomas in the inferior and nasal visual field of her right eye.
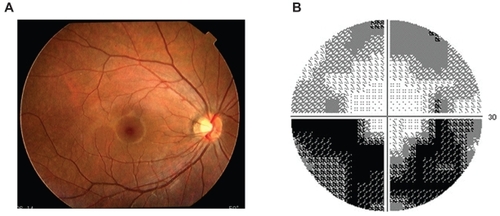
Figure 2 Case 1 Findings one year later. A) Nearly normal panoramic fundus photograph of the right eye. B) Persistent visual field defect characterized by enlargement of blind spot and scattered scotomas. C) Single-flash full-field electroretinograms (ERGs) were within the normal limits in both eyes. D) Flicker (30-Hz) ERG from both eyes showing a reduction in the amplitude and significant phase delay in the amplitude in the right eye.
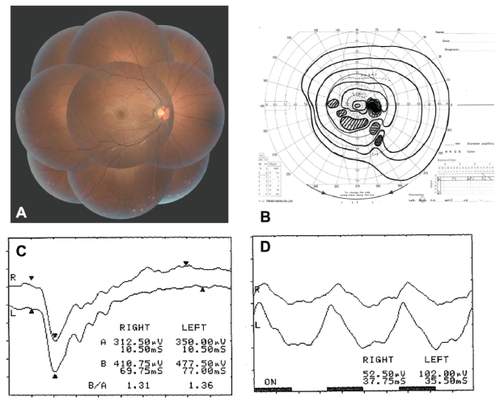
Figure 3 Case 1 Findings one year later. A) Optical coherence tomographic image of a 6-mm horizontal scan showing the loss of middle line and slightly decreased IS/OS line (arrow). B) Retinal volume map of the right and left eyes. The retina in right eye is thinner than that of the fellow eye by volume scan analysis. Values underlined = reduced by <10% and by dotted lines by <3%.
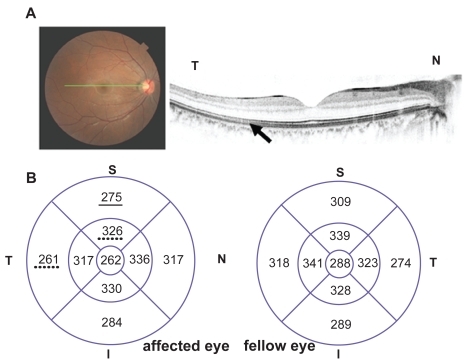
Figure 4 Case 2 Findings in a 29-year-old woman with AZOOr at onset. A) Nearly normal fundus photograph of posterior pole of the left eye. B) Dense superior visual field defects. C) Topographic map of multifocal ERGs showing markedly reduced responses in the macular area. D) Time-domain optical coherence tomography image showing a reduction of the outer nuclear layer.
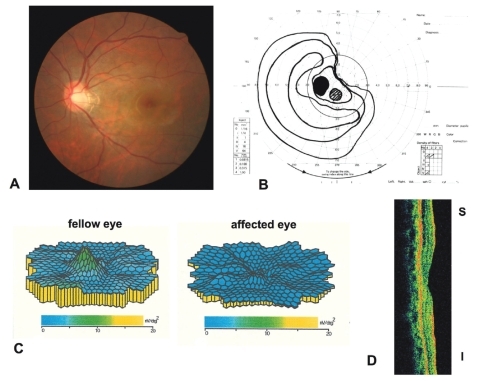
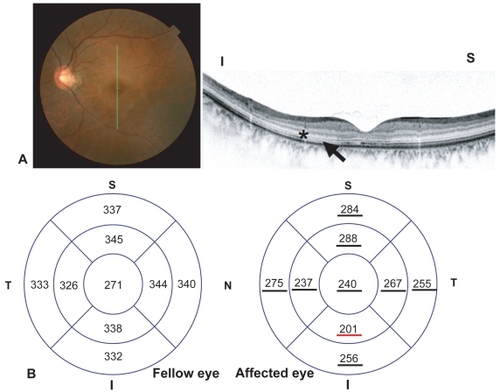
Figure 5 Case 2 Panoramic fundus photograph of left eye four years after onset. The localized retinal detachment (*) is well-demarcated by pigmentation (arrow).
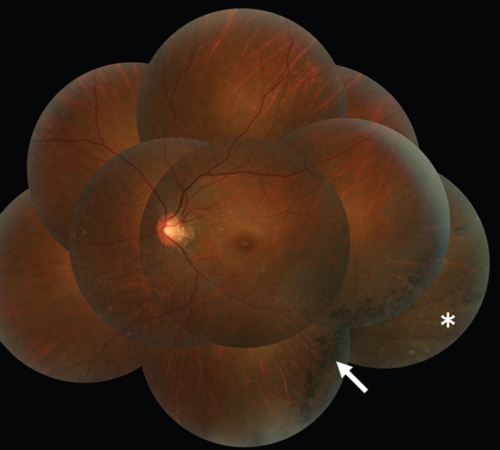
Figure 6 Case 2 Findings four years after onset. A) Spectral domain optical coherence tomography image of a 6-mm vertical scan showing the attenuated IS/OS line (arrow) and severely decreased outer nuclear layer (*), outer plexiform layer and inner nuclear layer. B) Decreased retinal thickness in left eye compared with fellow eye by volume scan analysis. Underlines; decreased less than 10% or red line; less than 40%.