Figures & data
Table 1 Demographic data
Table 2 Pearson correlation of the entire group
Table 3 Pearson correlation of the 1st group (ocular hypertension)
Table 4 Pearson correlation of the 2nd group (preperimetric glaucoma)
Table 5 Pearson correlation of subgroup A of the 2nd group
Table 6 Pearson correlation of subgroup B of the 2nd group
Table 7 Pearson correlation of the 3rd group (glaucomatous)
Figure 1 Correlation between OCT and visual fields for the right (OD) and left (OS) eye. The correlation is based on the Urlich model for the distribution of the RNFL around the optic disk.
Abbreviation: OCT, optical coherence tomography.
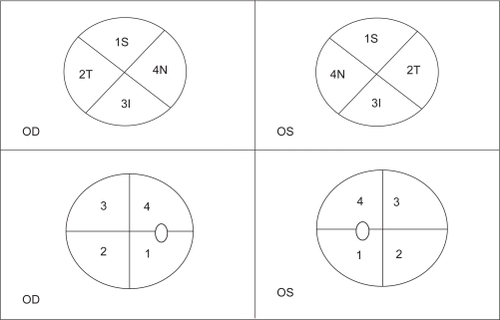
Table 8 Pearson correlation of group 3 (early glaucoma) for respective areas