Figures & data
Figure 1 Results of microperimetry. Twenty-four loci covering the central 10° were examined by Micro Perimeter 1 (MP1). Four measurement points were located within the central 2° of the macula, and 24 measurement points were located within the central 10° of the macula.
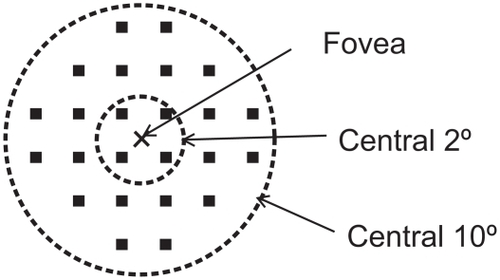
Figure 2 Fundus photographs, fluorescein angiograms, optical coherence tomographic (OCT) images, and Micro Perimeter 1 (MP1) images from a 61-year-old man (Case 1) whose visual acuity (VA) was reduced to 20/60 secondary to classic and occult choroidal neovascularization (CNV) in his left eye. Top left: Fundus photograph showing subretinal hemorrhage and classic CNV (white arrow) before treatment. Top middle: Fluorescein angiogram (FA) showing minimally classic CNV. Photodynamic therapy was performed with a 3500 im laser spot on the area indicated by the yellow dotted circle. Top right: Fundus photograph three months after photodynamic therapy (PDT) shows fibrosis of CNV and absorption of subretinal hemorrhage. VA was 20/50 at three and six months after PDT. Middle row, left: OCT image before PDT. Middle row, middle: OCT image three months after PDT showing a reduction in the size of the CNV. Middle row, right: OCT image at six months after PDT showing a reduction of foveal thickness. Bottom left: MP1 image shows a dense scotoma (not seen at 0 dB) in CNV component and subretinal hemorrhage. Mean retinal sensitivity within the central 10° is 5.0 dB before PDT. Bottom middle: Mean retinal sensitivity improved to 9.1dB at three months after PDT. Bottom right: Mean retinal sensitivity improved to 11.8 dB at six months after PDT. The patient did not report an improvement of the central visual disturbance of the left eyes. FA shows no leakage from CNV at three months after PDT.
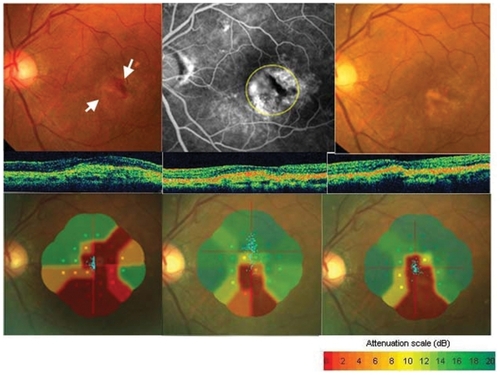
Table 1 Changes in visual acuity, foveal thickness, and mean retinal sensitivity
Figure 3 Relationship between changes in best-corrected visual acuity (BCVA) and changes in foveal thickness (FT). There is a significant parameters at six months after photodynamic therapy (r = 0.51; P = 0.03).
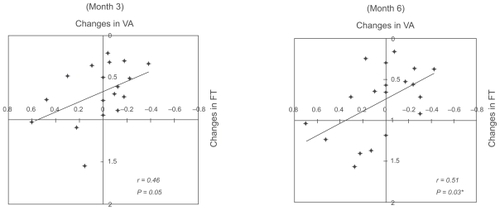
Figure 4 Relationship between changes in retinal sensitivity and the decrease in foveal thickness (FT). The changes in retinal sensitivity were significantly changes in foveal thickness. Data from within the central 2° (r = − 0.49; P = 0.038) and within the central 10° (r = − 0.59; P = 0.012).
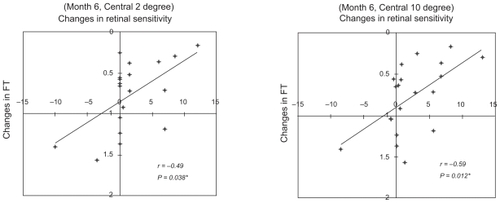
Figure 5 Relationship between changes in retinal sensitivity and changes in the best-corrected visual acuity (BCVA). Changes in retinal sensitivity was not significantly correlated to the BCVA within the central 2° (r = − 0.39; P = 0.09 [Left]) and within the central 10° (r = − 0.39; P = 0.09 [Right]).
![Figure 5 Relationship between changes in retinal sensitivity and changes in the best-corrected visual acuity (BCVA). Changes in retinal sensitivity was not significantly correlated to the BCVA within the central 2° (r = − 0.39; P = 0.09 [Left]) and within the central 10° (r = − 0.39; P = 0.09 [Right]).](/cms/asset/3ac75cd7-9cb7-4b4a-a8b6-984e6f1a1a2b/doph_a_6584_f0005_b.jpg)
Table 2 Subjective improvement and changes in VA, FT, and retinal sensitivity at six months after PDT
Table 3 Angiographic results and changes in visual acuity and retinal sensitivity at three months after PDT