Figures & data
Figure 1 Color fundus photograph of the right eye, depicting an optic nerve pit with peripapillary atrophy. Mild pigmentary changes are present in the macula. Arrow heads point to the margins of the pit.
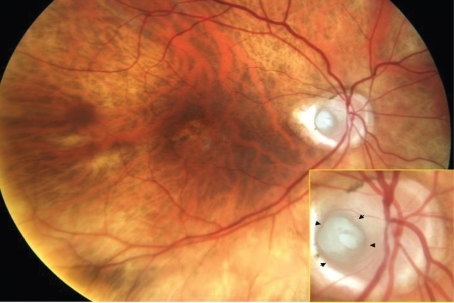
Figure 2 A) Combined infrared imaging and SD-OCT (spectralis; Heidelberg engineering, Germany) demonstrate excavation of the optic nerve with an adjacent area of outer retinal atrophy. Arrow heads pointing to the excavation seen on spectralis OCT. B) spectralis OCT scan demonstrates loss of the photoreceptor outer segments with preservation of the underlying retinal pigment epithelium. Arrow indicating the point where inner segment–outer segment junction of the photoreceptor becomes discontinues indicating atrophy. RPE is seen as a dark continuous band.
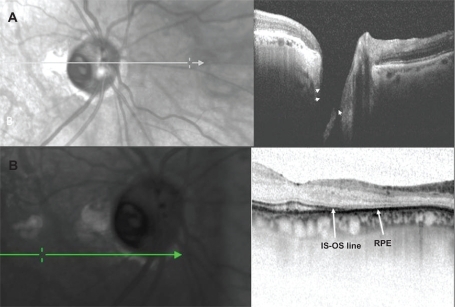
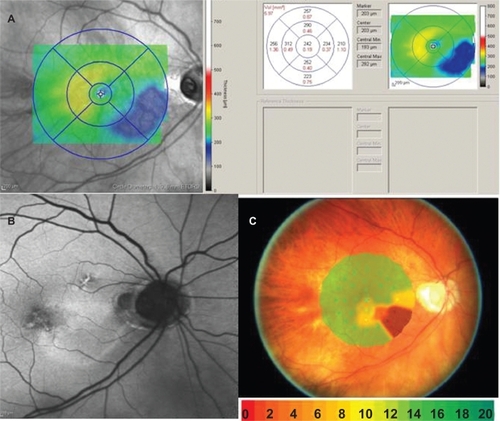
Figure 3 A) Retinal thickness mapping demonstrates thinning of the retina in the paillomacular bundle, extending inferior temporally. B) Fundus autoflourescence shows hyperfluorescence in the area of retinal thinning. C) Microperimetry (MP-1) demonstrates loss of threshold corresponding to the area of thinning. The blue dots are a fixation map of the patient while doing the test. Color codes indicate visual sensitivity in decibels.