Figures & data
Table 1 Minimum inhibitory concentrations (MIC90) for besifloxacin, moxifloxacin, and gatifloxacin against selected Staphylococcus isolates
Table 2 Demographics of intent-to-treat (ITT) population
Figure 1 Disposition of enrolled subjects.
aIncludes 1 subject discontinued due to investigator’s decision and 1 subject discontinued due to pregnancy. In the latter case, the subject had a negative pregnancy test at Visit 1, but reported that she had a positive pregnancy test prior to Visit 2a. The subject was discontinued immediately before the scheduled Visit 2a and did not receive any test medications.
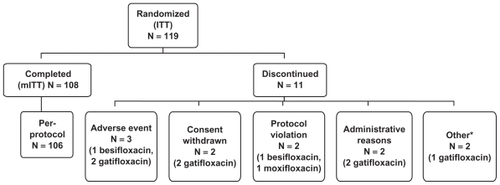
Table 3 Disposition of enrolled subjects
Table 4 Mean and median fluoroquinolone concentrations in conjunctival tissue (mITT population)
Figure 2 Conjunctival fluoroquinolone concentrations (μg/g) in individual subjects at 24 hours (mITT population).
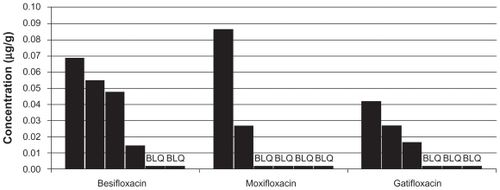
Figure 3 Mean fluoroquinolone concentration-time curves in conjunctiva (mITT population).
Abbreviation: mITT, modified intent-to-treat population (N = 108).
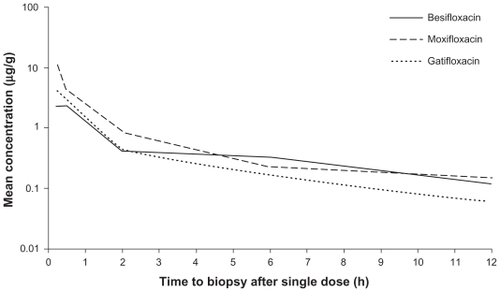
Table 5 Area-under-the-curve over 24 hours (AUC0–24 h) and mean residence time (MRT) for fluoroquinolones in conjunctiva
Table 6 Treatment-related adverse events (AEs) occurring in the safety population
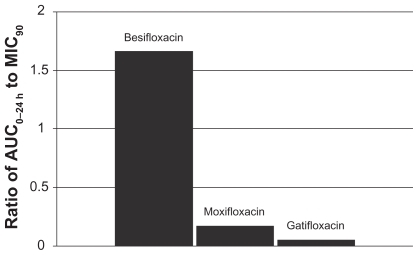
Figure 4 Ratio of fluoroquinolone AUC0–24 h in conjunctiva to the MIC90 for methicillin-sensitive S. aureus (MSSA) (mITT population).a
aMIC90 values were obtained from susceptibility testing of 144 methicillin-sensitive, ciprofloxacin-sensitive S. aureus isolates. The values were 0.06 μg/mL for besifloxacin, 0.12 μg/mL for moxifloxacin, and 0.25 μg/mL for gatifloxacin.Citation7
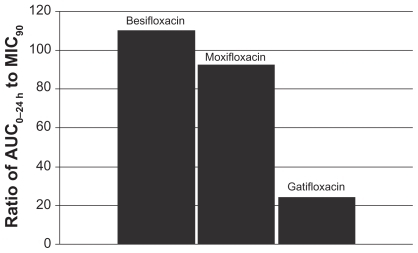
Figure 5 Ratio of fluoroquinolone AUC0–24 h in conjunctiva to the MIC90 for methicillin-resistant S. aureus (MRSA) (mITT population).a
aMIC90 values were obtained from susceptibility testing of 81 methicillin-resistant, ciprofloxacin-resistant S. aureus isolates. The values were 4 μg/mL for besifloxacin, 32 μg/mL for moxifloxacin, and 64 μg/mL for gatifloxacin.Citation24
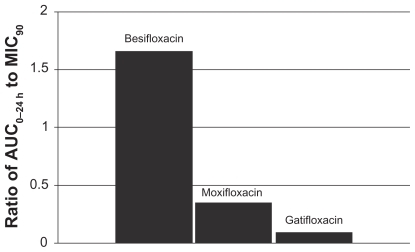
Figure 6 Ratio of fluoroquinolone AUC0–24 h in conjunctiva to the MIC90 for methicillin-sensitive S. epidermidis (MSSE) (mITT population).a
aMIC90 values were obtained from susceptibility testing of 50 methicillin-sensitive, ciprofloxacin- sensitive S. epidermidis isolates. The values were 0.06 μg/mL for besifloxacin, 0.12 μg/mL for moxifloxacin, and 0.25 μg/mL for gatifloxacin.Citation7
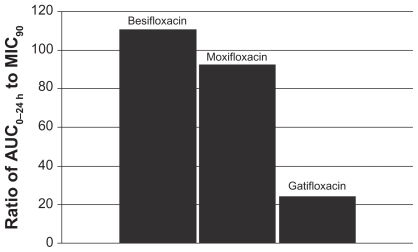
Figure 7 Ratio of fluoroquinolone AUC0–24 h in conjunctiva to the MIC90 for methicillin-resistant S. epidermidis (MRSE) (mITT population).a
aMIC90 values were obtained from susceptibility testing of 29 methicillin-resistant, ciprofloxacin-resistant S. epidermidis isolates. The values were 4 μg/mL for besifloxacin, 64 μg/mL for moxifloxacin, and 128 μg/mL for gatifloxacin.Citation24