Figures & data
Figure 1 COX-2 immunostaining in RCC and normal kidney (NK) tissues. COX-2 was strongly expressed in all slides from cancer specimens, clear cell RCC -G1, -G2 and G3 (B, C and D) and other types of RCC tissues (E; papillary RCC G3, F; collecting duct carcinoma chromophobe RCC G2, G; chromophobe RCC G2). No expression of COX-2 was detected in NK tissue (A). Immunostaining with PBS was negative (H).
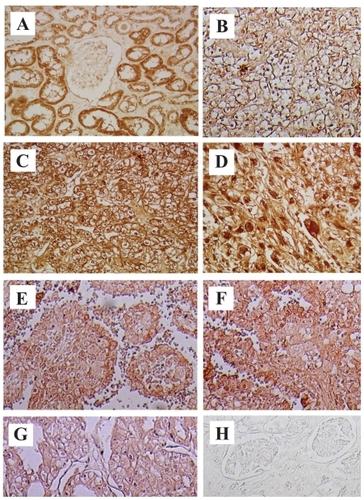
Table 1 Effects of COX and LOX inhibitors, and PPAR-γ ligand in viabity of human RCC cell line (Caki-1)
Figure 2 RT-PCR analysis of 5- and 12-LOX in RCC tissues and normal kidney (NK) tissues. Using specific primers for 5-LOX, 12-LOX and G3PDH, the amplification predicted fragments of 337 bp for 5-LOX, 345 bp for 12-LOX and 598 bp for G3PDH in length. A; 5-LOX, B; 12-LOX, C; G3PDH. Lane 1; markers, Lane 2; NK tissues, Lane 3; RCC tissues. RCC tissues expressed significant 5- and 12-LOX mRNA bands while NK tissues expressed no 5- and 12-LOX mRNA bands.
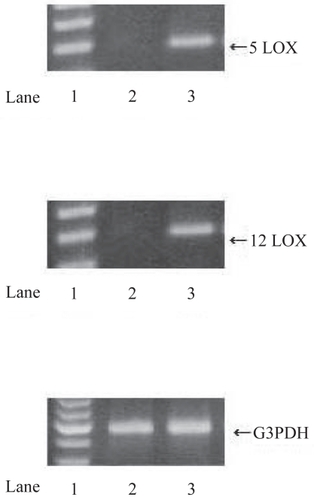
Table 2 Statistical analysis of 5-LOX and 12-LOX immunostaining
Figure 3 Effects of LOX inhibitor in induction of apoptosis on RCC cells. Human RCC cell line (Caki-1) treated with 5-LOX inhibitor caffeic acid (B), and nonspecific LOX inhibitor NDGA (D) showed chromatin condensation, cellular shrinkage, small membrane-bound bodies (apoptotic bodies), and cytoplasmic condensation. Cells with 12-LOX inhibitor baicalein only slightly showed the same apoptotic changes (C). In contrast, untreated cells (A) maintained normal chromatin patterns and cell size.
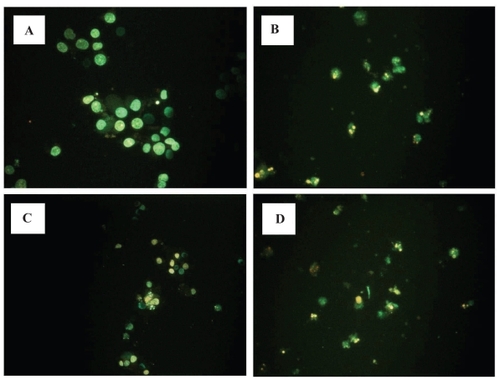
Figure 4 Effects of PPAR-γ ligand on apoptosis by flow cytometry in RCC cells. Human RCC cell line (Caki-1) with treatment of PPAR-γ ligand (25 μM troglitazone and 15-d-PGJ2) could induce early apoptosis not late apoptosis or necrosis. PPAR-γ ligand (25 μM) did not cause normal proximal tubular endothelial cells (PRTEC) to undergo apoptosis. The top left quadrants represent early apoptosis (Annexin V-FITC-positive cells and PI-negative cells). The top right quadrants represent late apoptosis or necrosis (Annexin V-FITC-positive cells and PI-positive cells). Diagrams of FITC-Annexin V/PI flow cytometry are presented.
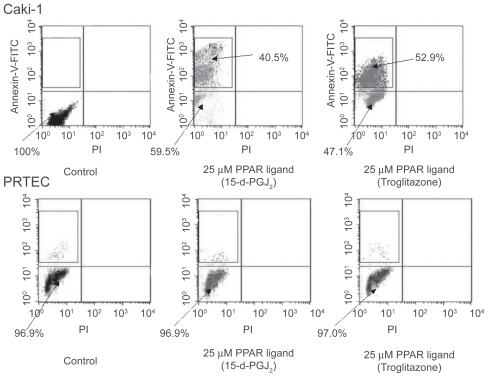
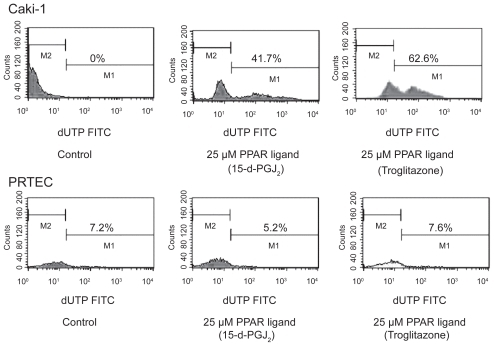
Figure 5 PPAR-γ ligand induced DNA fragmentation in RCC cells. PPAR-γ ligand (25 μM troglitazone and 15-d-PGJ2) could induce DNA fragmentation in human RCC cell line (Caki-1). PPAR-γ ligand (25 μM) did not cause normal proximal tubular endothelial cells (PRTEC) to undergo apoptosis. Typical flow cytometry analysis histograms are presented.