Figures & data
Figure 1 Self-reported adherence rates at different time points (T expressed in months) according to the specific recall periods and eventual dosing timing.
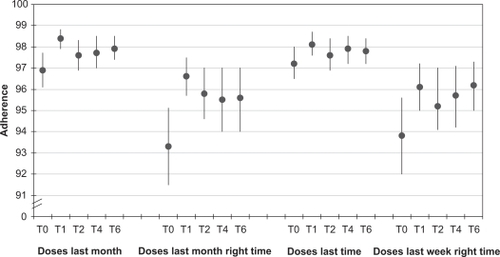
Figure 2 Baseline proportion of patients indicating the presence of specific symptoms possibly related to HAART. All symptoms were actively investigated by means of a structured questionnaire and patients were asked to grade the discomfort each symptom caused (VAS scale).
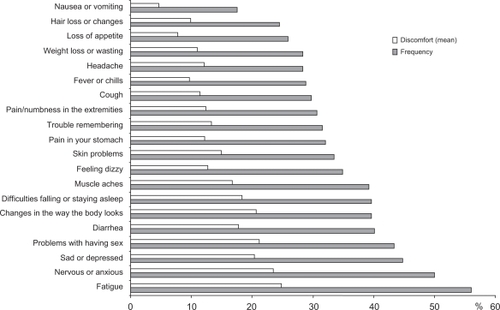
Figure 3 Influence of the presence and number of symptoms possibly related to HAART on the perception of health status at baseline. Box-plot analysis reporting median, interquartile range, 95% CI and outliers.
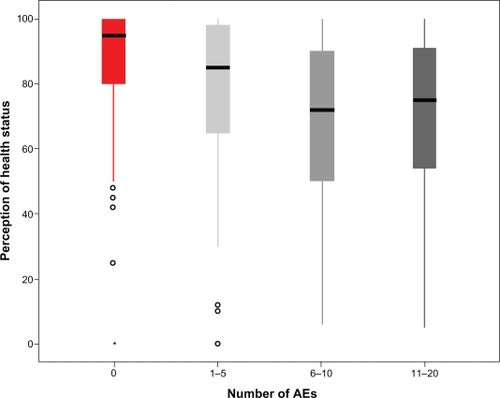
Figure 4 Variation of quality of life over time.
Abbreviation: QoL, quality of life.
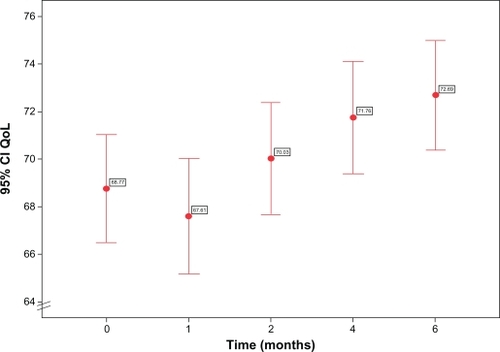
Figure 5 Influence of quality of life on adherence. Box-plot analysis reporting median, interquartile range, and outliers.
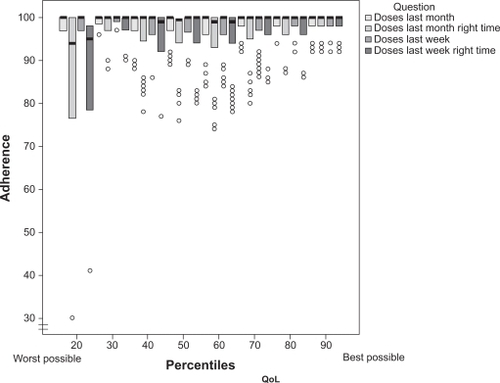
Figure 6 Patients’ preferences. Patients’ opinion was significantly in favor of the fixed dose combination (FDC) compared to the use of single drug pills (T0).
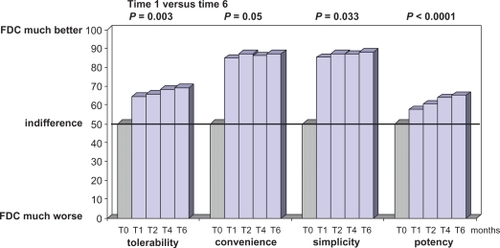
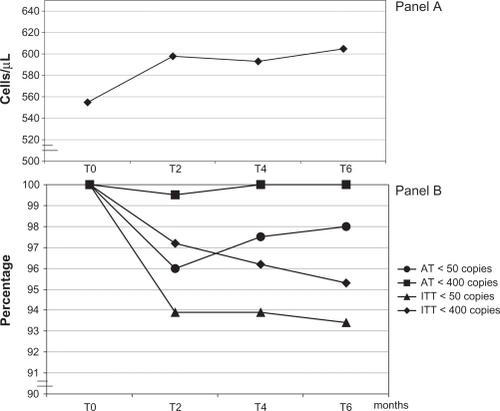
Figure 7 Immunolgic response (panel A) and virologic response (panel B). CD4 cell counts are expressed as means, while virologic outcome indicates the proportion of subjects below a determined threshold.