Figures & data
Table 1 Baseline patient characteristics
Figure 1 Conditional probabilities of being adherent to the five recommendations, given class membership.
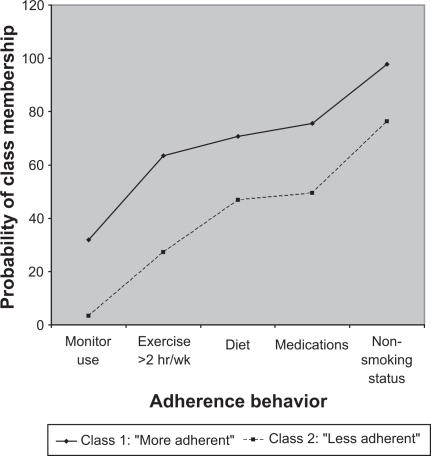
Table 2 Fit statistics of the latent class analysis models
Table 3 Conditional probabilities of class membership in the two-class mode
Table 4 Odds ratio of being a member of the “more adherent” class