Figures & data
Table 1 Patient demographics and baseline characteristics
Table 2 Changes in Positive and Negative Syndrome Scale total and subscale scores at endpoint, by treatment
Table 3 Drug Attitude Inventory items, percent agreeing at endpoint, by treatment
Figure 1 Completion rates, by endpoint Drug Attitude Inventory response for all patients. Patients with a positive attitude toward their medication had a greater likelihood of completing their treatment (*P < 0.05; ***P < 0.001).
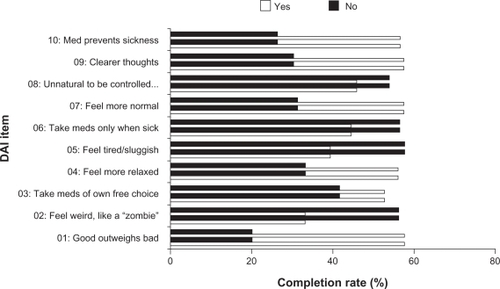
Table 4 Positive and Negative Syndrome Scale subscale score changes, by endpoint Drug Attitude Inventory response for all patients