Figures & data
Figure 1 Study Design – Each subject received a total of 24 injections in three sessions of 8 injections. With 40 subjects, a total of 960 injections were expected.
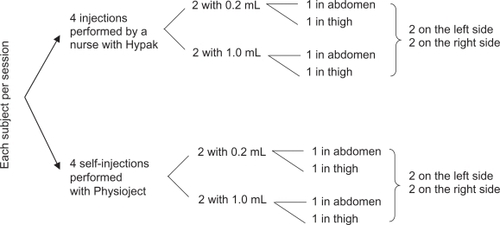
Table 1 Screening and inclusion population
Table 2 Fluid leakage and injected volume, gravimetric method (primary endpoint) – per protocol populationTable Footnotea
Figure 2 Box plots of depth of fluid depot in mm from skin surface after injection (ultrasound examination data). Description by device and volume for the per protocol population (mean, median, 25th and 75th percentiles, and range).
Note: *Statistically outlying values.
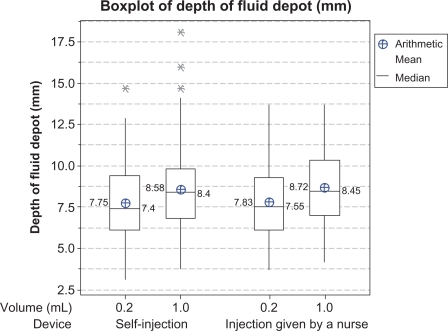
Figure 3 Perceived pain, 100 mm visual analog scale (VAS; secondary endpoint) – per protocol population.
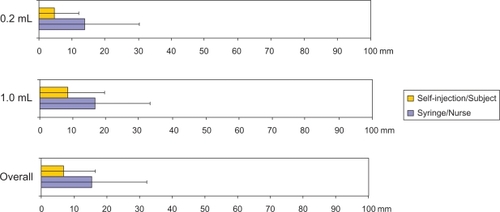
Table 3 Perceived pain, 100 mm visual analog scale (VAS) and verbal scale (VS) – per protocol population
Table 4 Local skin reactions at injection site – Safety populationTable Footnotea
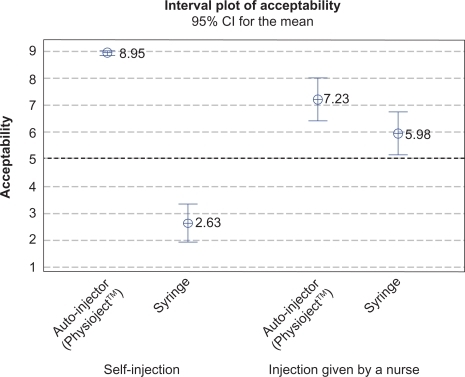
Figure 4 Device acceptability score for four injection scenarios (mean and 95% confidence interval).