Figures & data
Figure 1 Community perspectives of the poor and nonpoor based on community responses from Iganga and Bushenyi districts.
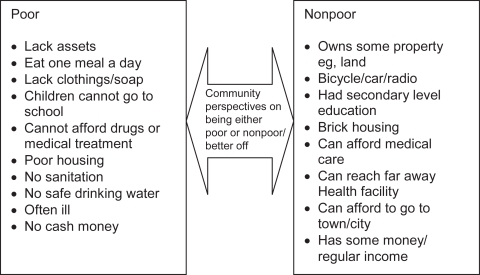
Table 1 Perceptions about good and poor quality services
Table 2 Factors that affect the quality of services
Table 3 How quality influences the utilization of health services