Figures & data
Table 1 Baseline patient characteristics
Table 2 Reasons for discontinuation by disease state
Table 4 Logistic regression results on impact of early therapeutic response and adverse reactions
Table 5 Logistic regression likelihood ratio tests results
Table 6 Cox regression results on continuous effect of treatment response and adverse reactions
Table 7 Cox regression likelihood ratio tests results
Figure 1 Visit-wise 24-hour average pain severity scores between patients who completed therapy phase and those who discontinued early in DPNP studies.
Values are means across all treatments and studies.
*p value < 0.05 between group differences. Avg, average; COM, completers; D/C, discontinue.
(N) denotes number of patients at specific time point.
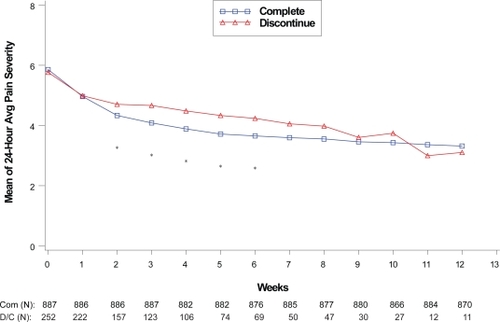
Figure 2 Visit-wise brief pain inventory scores between patients who completed therapy phase and those who discontinued early in fibromyalgia studies.
Values are means across all treatments and studies.
*p value < 0.05 between group differences. COM, completers; D/C, discontinue.
(N) denotes number of patients at specific time point.
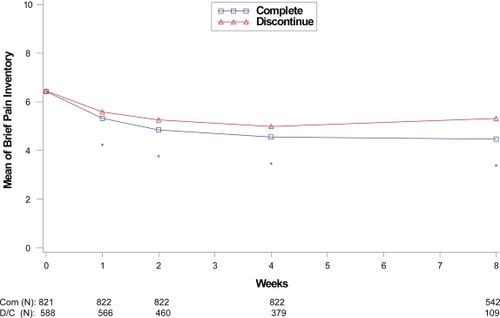
Figure 3 Visit-wise HAMA Total scores between patients who completed therapy phase and those who discontinued early in GAD studies.
Values are means across all treatments and studies.
*p value < 0.05 between group differences. COM, completers; D/C, discontinue.
(N) denotes number of patients at specific time point.
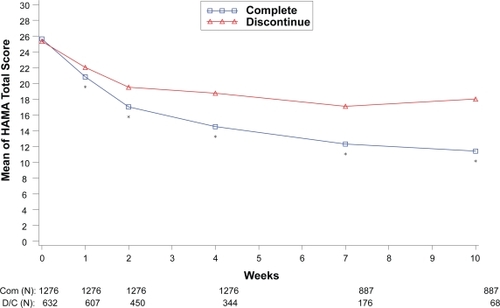
Figure 4 Visit-wise HAMD-17 Total scores between patients who completed therapy phase and those who discontinued early in MDD studies.
Values are means across all treatments and studies
*p value < 0.05 between group differences. COM, completers; D/C, discontinue.
(N) denotes number of patients at specific time point.
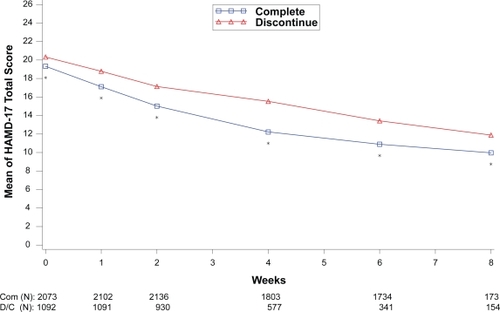
Figure 5 Visit-wise 24-hour average pain severity scores between patients who completed therapy phase and those who discontinued early for various reasons in DPNP studies.
Values are means across all treatments and studies.
*p value < 0.05 between group differences. Avg, average; AE, adverse events; COM, completers; DC, discontinue; LOE, lack of efficacy; OTH, other reasons.
(N) denotes number of patients at specific time point.
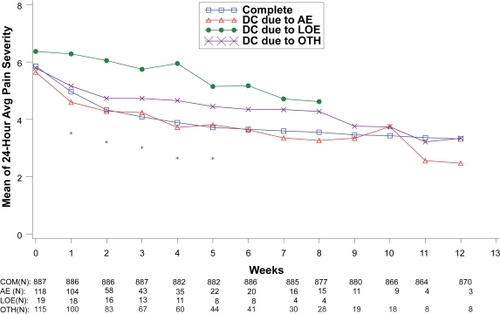
Figure 6 Visit-wise brief pain inventory scores between patients who completed therapy phase and those who discontinued early for various reasons in fibromyalgia studies.
Values are means across all treatments and studies.
*p-value < 0.05 between group differences. AE, adverse events; COM, completers; DC, discontinue; LOE: lack of efficacy; OTH, other reasons.
(N) denotes number of patients at specific time point.
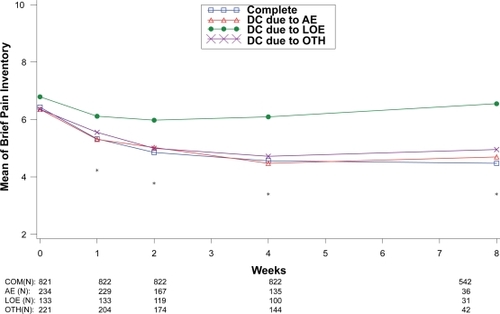
Figure 7 Visit-wise HAMA total scores between patients who completed therapy phase and those who discontinued early for various reasons in GAD studies.
Values are means across all treatments and studies.
*p value < 0.05 between group differences. AE, adverse events; COM, completers; DC, discontinue; LOE, lack of efficacy; OTH, other reasons.
(N) denotes number of patients at specific time point.
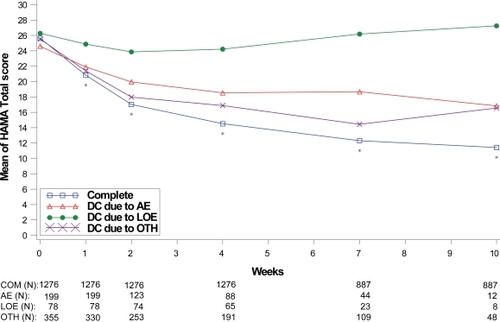
Figure 8 Visit-wise HAMD-17 total scores between patients who completed therapy phase and those who discontinued early for various reasons in MDD studies.
Values are means across all treatments and studies.
*p value < 0.05 between group differences. AE, adverse events; COM, completers; DC, discontinue; LOE, lack of efficacy; OTH, other reasons.
(N) denotes number of patients at specific time point.
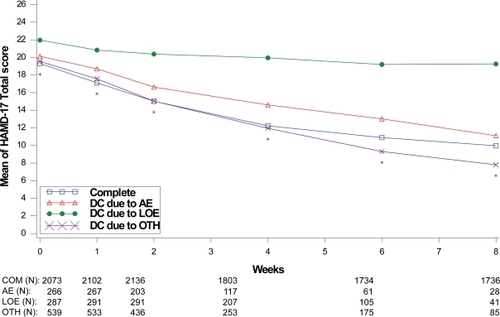
Table 3 Average discontinuation percentages by disease state and duration