Figures & data
Figure 1 Participant screening process (initial sample size = 579).
Note: From the initial pool of 579 patients, 20 patients entered the survey but did not answer any questions, hence were excluded from the study.
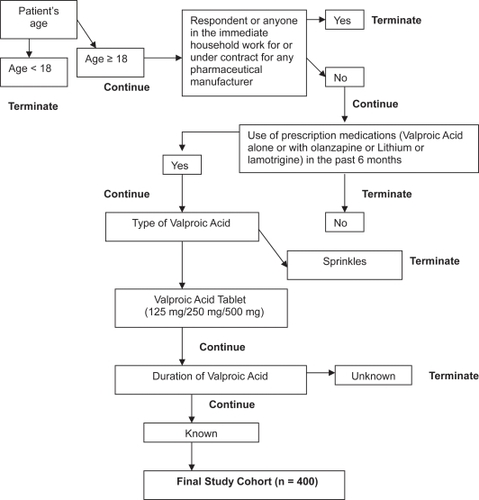
Table 1 Respondent characteristics (N = 400)
Table 2 Valproate (VP) utilization patterns
Figure 2 Reasons for discontinuing valproate (VP) (n = 164, multiple responses were accepted; only top responses are shown).
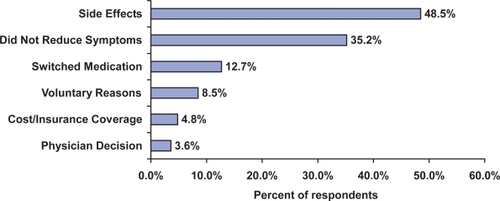
Table 3 Respondent perceptions and treatment preference
Table 4 Treatment preference (univariate analyses)
Table 5 Predictors of treatment preference (multivariate analysis)
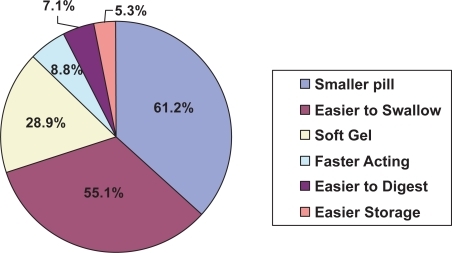
Figure 3 Reasons for valproate (VP) tablet preference (n = 59).
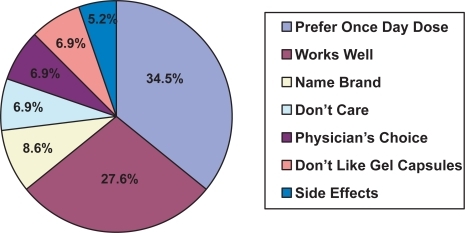
Figure 4 Reasons for Product X (soft gel) preference (n = 341).