Figures & data
Table 1 Baseline characteristics of 45 enrolled patients
Figure 1 Assessments of health status and decision-making role.
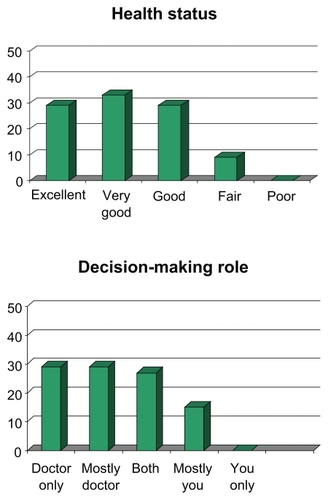
Figure 2 Box plots of preference values for HCV disease outcomes assessed by visual analog score.
Abbreviation: CH, chronic hepatitis; CIRR, cirrhosis; HCV, hepatitis C virus.
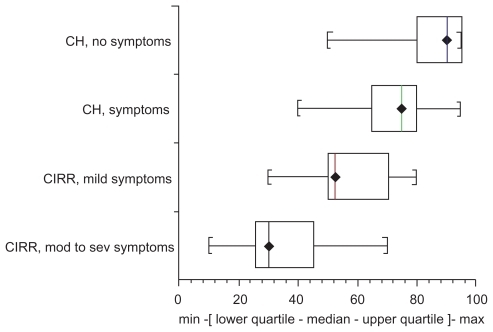
Figure 3 Box plots of preference values for HCV treatment’ outcomes assessed by visual analog score.
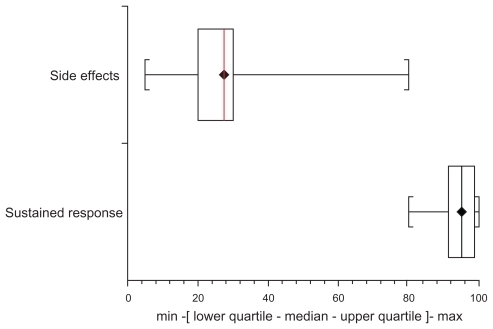
Figure 4 Box plots of patient’ estimates of benefit to recommend antiviral treatment.
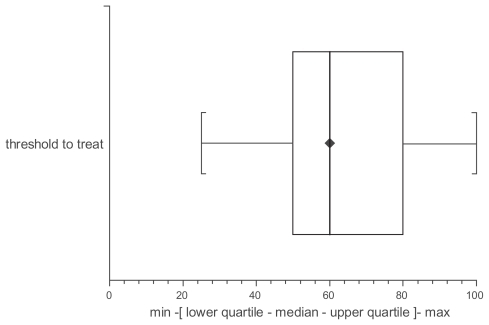
Table 2 Assessment of decision-making role by CPS
Table 3 Patient’s utilities of health states with HCV by rating scale method
Appendix 1 Decision-making role by control preferences scale
Appendix 2 Description of six scenarios of health with HCV (Cotler, modified)