Figures & data
Figure 1 Patient selection. Patients were identified from a commercial insurance database and analyzed retrospectively to identify those with mild asthma who initiated treatment with an ICS. Patients who met all inclusion and exclusion criteria were assigned to 1 of 2 control/adherence cohorts based on the number of exacerbation events and percent days covered in the pre-index period: HCHA, 0 exacerbation events and ≥60% PDC; LCLA, ≥2 exacerbation events and <10% PDC.
*Criterion included owing to the initial existence of a fluticasone propionate with salmeterol cohort, which is not presented in the current analysis.
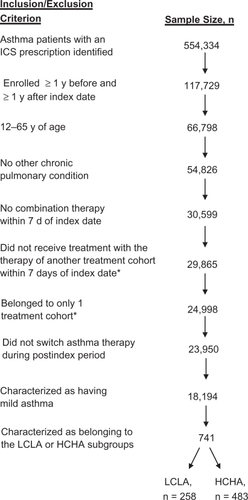
Table 1 Demographics and characteristics at index date
Figure 2 Resource utilization. The mean number of post-index asthma-related medical records, asthma days, OCS prescriptions, and ICS records among patients assigned to the HCHA or LCLA cohort are depicted. Error bars represent standard error of the mean.
*P < 0.0001.
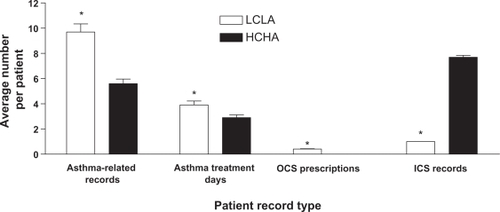
Figure 3 Asthma-related charges. The mean post-index asthma-related inpatient, outpatient, pharmaceutical, and total charges among patients assigned to the HCHA or LCLA cohort are depicted. Error bars represent standard error of the mean.
*P ≤ 0.0001.
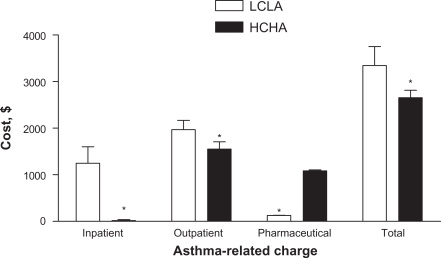
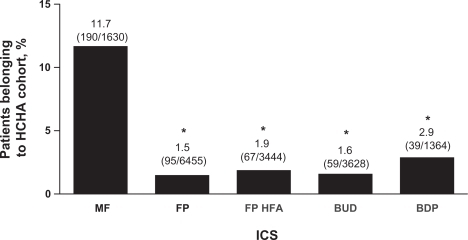
Figure 4 ICS use associated with HCHA. The percentages of patients included in the current analysis that were treated with MF, FP, FP HFA, BUD, or BDP and assigned to the HCHA cohort are depicted. Percentages for each ICS group represent the number of patients who were treated with each respective ICS and qualified for the HCHA cohort divided by the total number of patients who were treated with each respective ICS. Error bars represent standard error of the mean.
*P < 0.0001 vs MF.