Figures & data
Table 1 Baseline characteristics of HIV–HCV coinfected patients
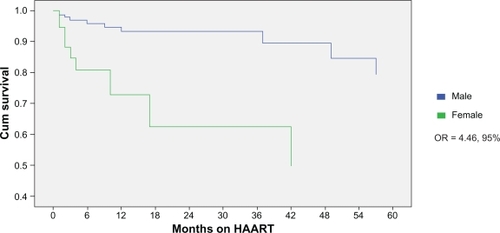
Figure 1 Months on HAART by sex prior to interruption or treatment change.
Abbreviation: HAART, highly-active antiretroviral therapy.
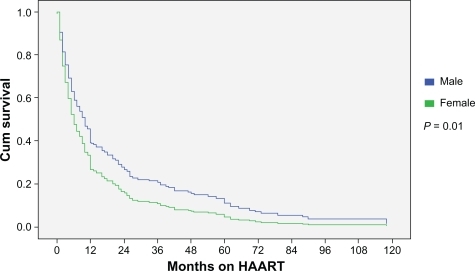
Table 2 HAART composition for HIV–HCV patients starting treatment
Table 3 Primary reasons for therapy interruption by sex
Figure 2 Comparison of cumulative survival by sex.
Abbreviations: CI, confidence intervals; HAART, highly-active antiretroviral therapy; OR, odds ratio.