Figures & data
Figure 1 Receiver operating characteristic (ROC) curves on the full data for the 4 scores.
Abbreviations: CNS, Canadian Neurological Score; NIH, National Institute of Health.
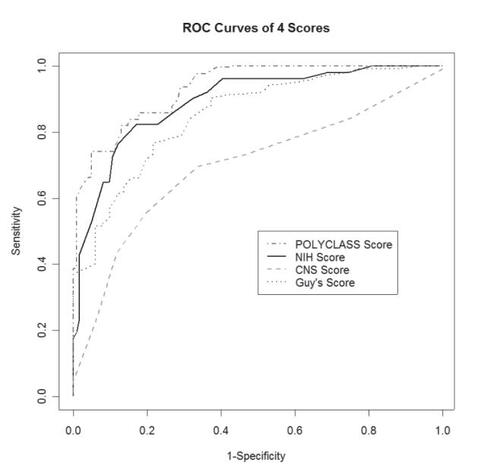
Table 1 Estimated area under the ROC and inference for the four scoring methods. The standard error was estimated using method proposed by CitationDeLong and colleagues (1988)
Table 2 Results from cross-validation showing the specifi city for fi xed sensitivities that are at least 90% on the training data sets for the 3 scores and POLYCLASS. The resulting sensitivities and specifi cities are shown for the validation data sets (those data not used for determining the cut-offs)