Figures & data
Figure 1 The individual serum concentrations versus time profiles of morphine, M3G and M6G after IV administration of morphine and of oxycodone and noroxycodone after IV administration of oxycodone. Please notice the different axes.
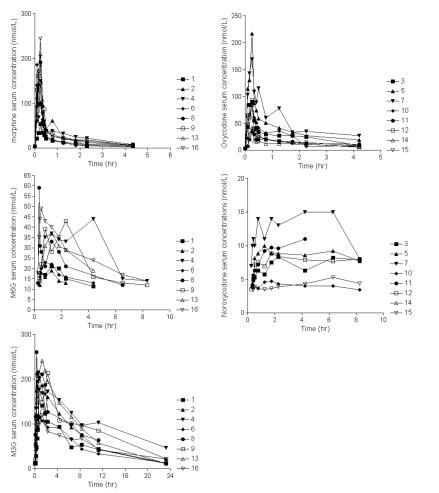
Figure 2 The best fit of morphine (A) and oxycodone (B) serum concentrations after applying a 2-compartment pharmacokinetic model. Open circles are mean observed concentrations, while the solid lines are the mean predicted concentrations using the best model. The dotted lines are 95% confidence interval on the mean observed values.
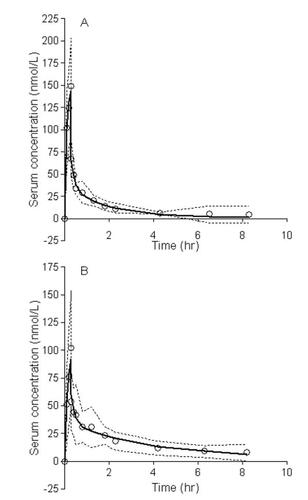
Table 1 Pharmacokinetic characteristics of morphine and oxycodone in elderly patients