Figures & data
Table 1 Patient perceptions of the most severe side effects of cancer chemotherapy
Figure 1 Perception vs reality: Healthcare providers’ predictions of incidence, and observed incidence, of nausea and vomiting following chemotherapy (Drawn from data in CitationGrunberg, Deusson et al 2004).
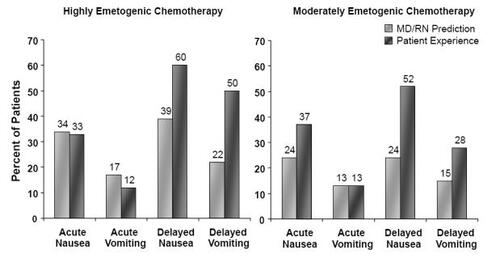
Figure 2 Schematic diagram of vomiting reflex.
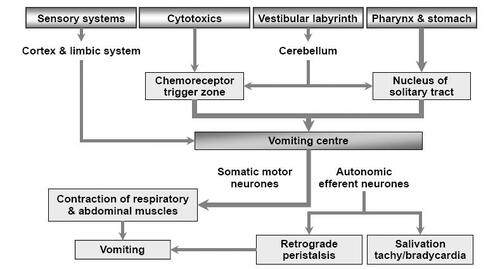
Figure 3 Molecular structure of palonosetron hydrochloride.
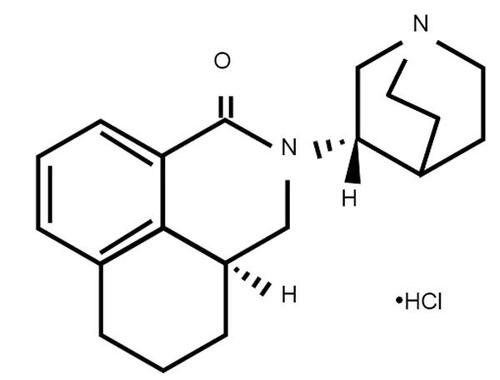
Figure 4 Percentage of MEC patients achieving complete response rates in the acute, delayed, and overall phases following treatment with palonosetron 0.25 mg or ondansetron 32 mg/dolasetron 100 mg (Drawn from data in CitationRubenstein et al 2003; CitationGrunberg, Vanden Burgt et al 2004).
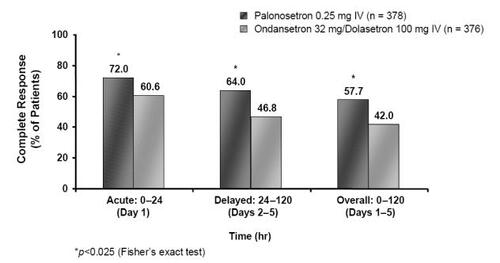
Figure 5 Percentage of emesis-free MEC patients in the acute, delayed and overall phases following treatment with palonosetron 0.25 mg or ondansetron 32 mg/dolasetron 100 mg (Drawn from data in CitationRubenstein et al 2003).
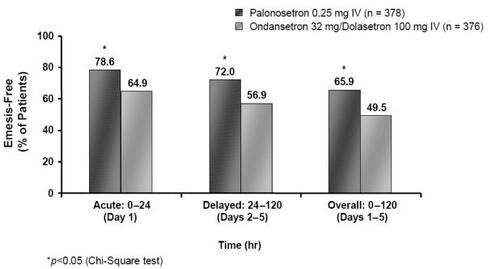
Figure 6 Percentage of nausea-free MEC patients on a daily basis following treatment with palonosetron 0.25 mg or ondansetron 32 mg/dolasetron 100 mg (Drawn from data in CitationRubenstein et al 2003).
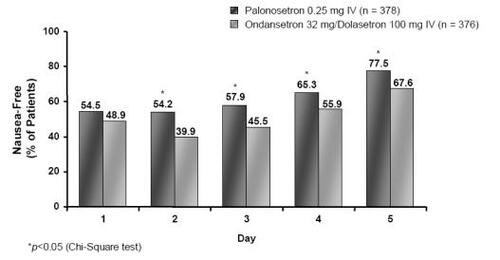
Table 2 Percentage of nausea-free patients in a pooled analysis of patients receiving single infusion of palonosetron 0.25 mg prior to MEC (CitationDecker et al 2006) compared with patients receiving concomitant infusion of palonosetron 0.25 mg + dexamethasone 8 mg (CitationHajdenberg et al 2006) on Day 1 only.