Figures & data
Figure 1 A light micrograph of a house dust mite (Dermatophagoides pteronyssinus).These mites are around 100–300 µm and their secretions contain multiple soluble allergenic proteins. Glasgow University Hunterian Museum Zoology Specimen 127238.
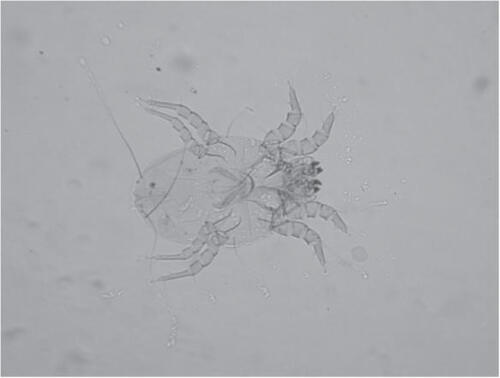
Figure 2 The proportion of atopic individuals from a West of Scotland general allergy clinic with serum IgE antibody to the allergens from house dust mite,grass, cat, and dog dander.
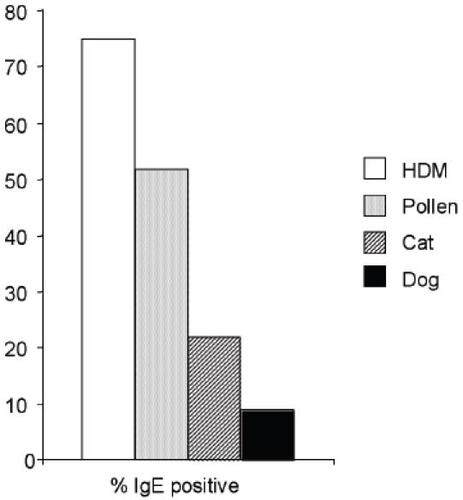
Figure 3 Dot plot illustrating the individual concentrations of the major house dust mite allergen Der p1 measured as µg per g of settled house dust collected from carpets in 139 randomly selected houses in the West of Scotland.
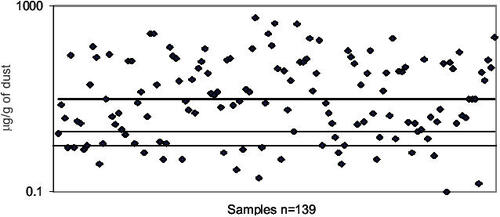
Table 1 A list of physical and chemical interventions used to reduce and remove house dust mites and their allergens from the indoor environment
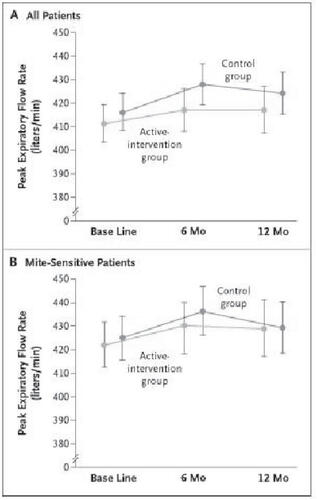
Figure 4 Mean morning peak expiratory flow rate in the Active-Intervention and Control Groups at Base Line, 6 Months, and 12 Months among All Patients (Panel A) and among Mite-Sensitive Patients (Panel B). Data points represent the geometric means, and I bars the 95 percent confidence intervals. Copyright © 2003. Reproduced with permission from Woodcock A, Forster, L, Matthews, et al. 2003. Control of exposure to mite allergen and allergen-impermeable bed covers for adults with asthma. N Eng J Med, 349:225-36.