Figures & data
Figure 1 Relative risk (RR)-intervals and associated PD2i’s determined from the electrocardiogram (ECG) of a normal healthy person and two types of PhysioBank patients. A. Shows RR data and corresponding PD2i results from a normal healthy subject (15 min ECG). B. Shows results from an arrhythmia control patient (30 min ECG, PhysioBank). C. Shows results from a VF/VT patient (30 min ECG, PhysioBank). PD2i values are expressed in degrees of freedom (dimensions) and RR values in msec; VF is included in the analysis for illustrative purposes only. Parts A-C each show 4 individual plots for comparing the data and the analytic results: upper left the RR-intervals (RRi), lower left the corresponding PD2i, upper right the joint plot of RRi and PD2i, lower right the histogram of the accepted PD2i values with its associated statistics, including %N. The ECG for the RRi shown in Part C. manifests VF at 17 minutes from the start and the PD2i before VF shows repeated low-dimensional excursions fall below 1.4 (line). The ECG shown in Part B. did not manifest any PD2i below 1.4 throughout the 30-min period. The test result indicated in the upper right plot (underlined) was completely automated by the Vicor 2.0 software once the input file was entered.
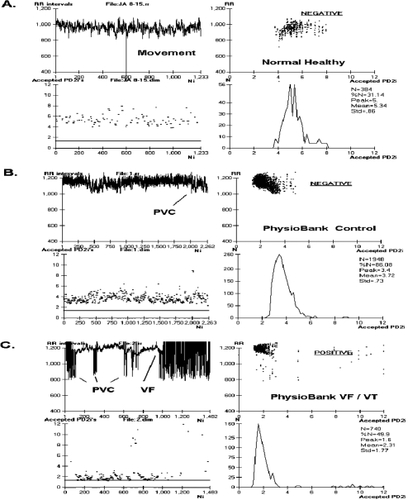
Figure 2 PD2i traces from arrhythmia controls and malignant arrhythmia subjects for the first half of the data set. PD2i values are expressed in degrees of freedom (dimensions) and the heartbeats are those obtained in a 15- to 30-min ECG up to the end or point of VF/VT onset. Note the low-dimensional excursions of the PD2i in the VF/VT subjects. The horizontal a priori criterion lines are set at 1.4 degrees of freedom and completely separate the two groups of patients. The rejected PD2i points are due to noise produced by arrhythmias and movement artifacts, but %N remains high enough in these patients for valid analysis. Surrogate- and %N-rejected files (n = 11) are not shown as they were a priori rejected (5 VF/VT, 6 controls). These rejected files contained all subjects with atrial fibrillation and the highest arrhythmia rates (ie, greater than 10% arrhythmias in all beats).
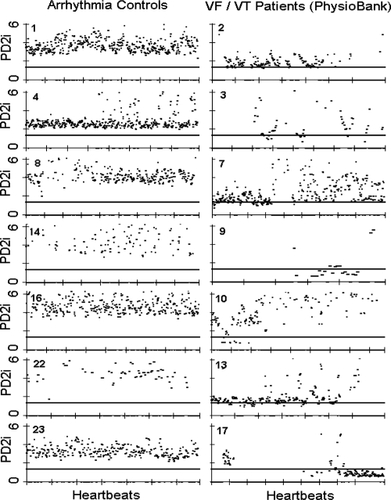
Table 1 PD2i of heartbeats predicts VF/VT in PhysioBank ECGsa