Figures & data
Table 1 Hospital deaths after inpatient surgeriesTable Footnotea
Figure 1 Risk factors for 48 h and 30 d postoperative mortality. For each panel, the y-axis shows the incidence of mortality (%) 48 h or 30 d postoperatively, and the x-axis shows the ASA PS of the patient (A; 1–5 scale), the patient’s age (B; years), the emergency status of the operation (C), whether the operation was a trauma case (D), whether the patient was hypothermic perioperatively (E), whether a perioperative adverse event occurred (F), and whether the operation resulted in postoperative intensive care unit admission (G). In some panels, the exact percentage is noted with an arrow (eg, “0” refers to “0%”).
Abbreviations: ASA PS, American Society of Anesthesiologists physical status; d, day; h, hour; NS, not significant.
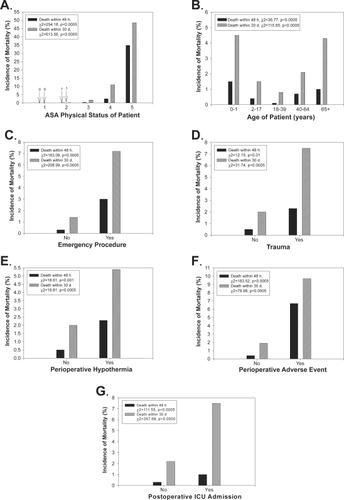
Figure 2 Risk factors for 48 h and 30 d postoperative mortality. For each panel, the y-axis shows the incidence of mortality (%) 48 h or 30 d postoperatively, and the x-axis shows the anesthesia type (A; MAC, regional anesthesia, general anesthesia or combined), the total time under anesthesia care (B; minutes), the use of invasive monitoring via arterial line (C), cardiovascular catheter (D) or pulmonary artery catheter (E), and whether the operation involved deliberate intraoperative hypotension (F). In some panels, the exact percentage is noted with an arrow (eg, “0” refers to “0%”).
Abbreviations: d, day; h, hour; MAC, monitored anesthesia care; NS, not significant.
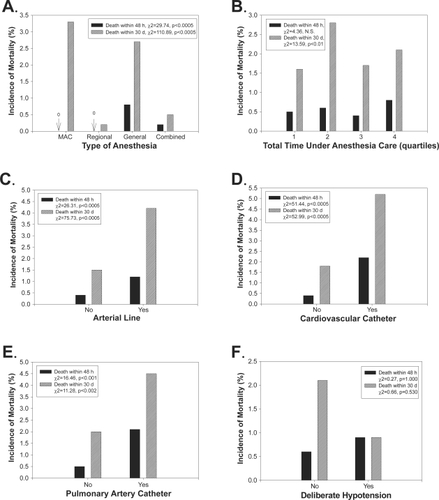
Table 2 Generalized estimating equations model for 48 hour and 30 day postoperative mortalityTable Footnotea