Figures & data
Table 1 Clinical characteristics of study cohort
Table 2 Contingency table for primary results
Table 3 Clinical characteristics and outcome distributions
Table 4 Test for homogeneity of enrollment groups
Figure 1 Receiver-operator curve (ROC) for all data with a positive or negative PD2i Test. The ROC determines the criterion cut-point for the PD2i Test that maximizes the sensitivity and specificity. At a cut-point of PD2i ≤ 1.4, the maximum sensitivity and specificity are found with the area under the ROC being high (0.92).
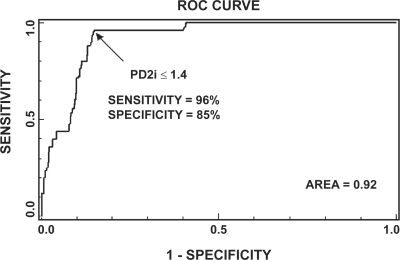
Figure 2 RR intervals and associated PD2is from two types of patients. Upper panel shows RR data and corresponding PD2i results from a patient who experienced documented arrhythmic death (AD) within 24 hours; note the two patterns of either a sustained low-dimension (line) or the systematic low-dimensional excursion (arrow). The lower panel shows data and results from a normal patient discharged after diagnosis of gastro-esophageal reflux disorder (CONTROL).
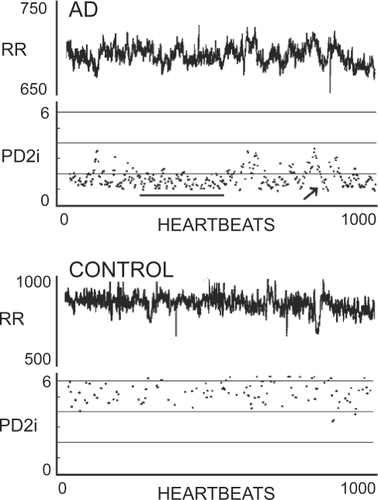
Figure 3 All-cause death vs time of occurrence after the brief ECG recording. Large squares indicate cardiac arrhythmic death (AD), as adjudicated by the Events Committee. All non-AD deaths are indicated by small unfilled squares, and include deaths due to cancer, sepsis, stroke, etc. AD patients admitted to low-level telemetry observation at admission are indicated by dots.
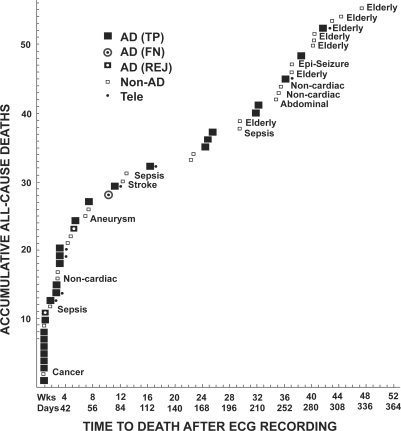
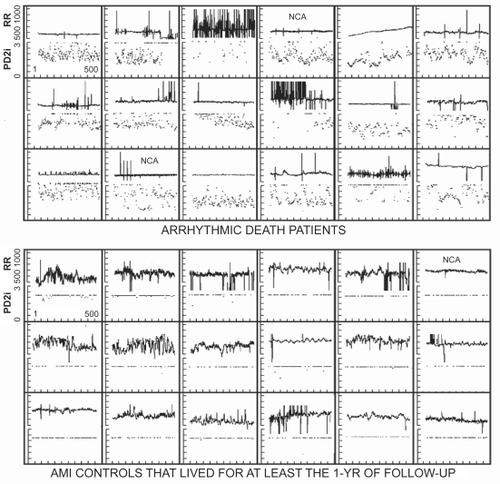
Figure 4 Composite RR and PD2i results for the first 18 arrhythmic death (AD) cases with all clinical data and no a priori exclusions for noise contamination. NCA = cases in which a single bit (noise-bit) was removed from each data point thus forcing the background noise level below ± 5 integers. In the acute myocardial infarction (AMI) controls all PD2i >3.0 are pushed down to the 3.0 line for display.